Immigrants from Western Europe vs Immigrants from Sudan Ambulatory Disability

COMPARE

Immigrants from Western Europe
Race
Ancestry
AfghanAfricanAlaska NativeAlaskan AthabascanAlbanianAleutAlsatianAmericanApacheArabArapahoArgentineanArmenianAssyrian/Chaldean/SyriacAustralianAustrianBahamianBangladeshiBarbadianBasqueBelgianBelizeanBermudanBhutaneseBlackfeetBolivianBrazilianBritishBritish West IndianBulgarianBurmeseCajunCambodianCanadianCape VerdeanCarpatho RusynCelticCentral AmericanCentral American IndianCherokeeCheyenneChickasawChileanChineseChippewaChoctawColombianColvilleComancheCosta RicanCreeCreekCroatianCrowCubanCypriotCzechCzechoslovakianDanishDelawareDominicanDutchDutch West IndianEastern EuropeanEcuadorianEgyptianEnglishEstonianEthiopianEuropeanFijianFilipinoFinnishFrenchFrench American IndianFrench CanadianGermanGerman RussianGhanaianGreekGuamanian/ChamorroGuatemalanGuyaneseHaitianHmongHonduranHopiHoumaHungarianIcelanderIndian (Asian)IndonesianInupiatIranianIraqiIrishIroquoisIsraeliItalianJamaicanJapaneseJordanianKenyanKiowaKoreanLaotianLatvianLebaneseLiberianLithuanianLumbeeLuxembourgerMacedonianMalaysianMalteseMarshalleseMenomineeMexicanMexican American IndianMongolianMoroccanNative HawaiianNavajoNepaleseNew ZealanderNicaraguanNigerianNorthern EuropeanNorwegianOkinawanOsageOttawaPaiutePakistaniPalestinianPanamanianParaguayanPennsylvania GermanPeruvianPimaPolishPortuguesePotawatomiPuebloPuerto RicanPuget Sound SalishRomanianRussianSalvadoranSamoanScandinavianScotch-IrishScottishSeminoleSenegaleseSerbianShoshoneSierra LeoneanSiouxSlavicSlovakSloveneSomaliSouth AfricanSouth AmericanSouth American IndianSoviet UnionSpaniardSpanishSpanish AmericanSpanish American IndianSri LankanSubsaharan AfricanSudaneseSwedishSwissSyrianTaiwaneseThaiTlingit-HaidaTohono O'OdhamTonganTrinidadian and TobagonianTsimshianTurkishU.S. Virgin IslanderUgandanUkrainianUruguayanUteVenezuelanVietnameseWelshWest IndianYakamaYaquiYugoslavianYumanYup'ikZimbabwean
Immigration
NonimmigrantsImmigrantsAfghanistanAfricaAlbaniaArgentinaArmeniaAsiaAustraliaAustriaBahamasBangladeshBarbadosBelarusBelgiumBelizeBoliviaBosnia and HerzegovinaBrazilBulgariaBurma/MyanmarCabo VerdeCambodiaCameroonCanadaCaribbeanCentral AmericaChileChinaColombiaCongoCosta RicaCroatiaCubaCzechoslovakiaDenmarkDominicaDominican RepublicEastern AfricaEastern AsiaEastern EuropeEcuadorEgyptEl SalvadorEnglandEritreaEthiopiaEuropeFijiFranceGermanyGhanaGreeceGrenadaGuatemalaGuyanaHaitiHondurasHong KongHungaryIndiaIndonesiaIranIraqIrelandIsraelItalyJamaicaJapanJordanKazakhstanKenyaKoreaKuwaitLaosLatin AmericaLatviaLebanonLiberiaLithuaniaMalaysiaMexicoMicronesiaMiddle AfricaMoldovaMoroccoNepalNetherlandsNicaraguaNigeriaNorth AmericaNorth MacedoniaNorthern AfricaNorthern EuropeNorwayOceaniaPakistanPanamaPeruPhilippinesPolandPortugalRomaniaRussiaSaudi ArabiaScotlandSenegalSerbiaSierra LeoneSingaporeSomaliaSouth AfricaSouth AmericaSouth Central AsiaSouth Eastern AsiaSouthern EuropeSpainSri LankaSt. Vincent and the GrenadinesSwedenSwitzerlandSyriaTaiwanThailandTrinidad and TobagoTurkeyUgandaUkraineUruguayUzbekistanVenezuelaVietnamWest IndiesWestern AfricaWestern AsiaWestern EuropeYemenZaireZimbabweAzores
Immigrants from Sudan
Race
Ancestry
AfghanAfricanAlaska NativeAlaskan AthabascanAlbanianAleutAlsatianAmericanApacheArabArapahoArgentineanArmenianAssyrian/Chaldean/SyriacAustralianAustrianBahamianBangladeshiBarbadianBasqueBelgianBelizeanBermudanBhutaneseBlackfeetBolivianBrazilianBritishBritish West IndianBulgarianBurmeseCajunCambodianCanadianCape VerdeanCarpatho RusynCelticCentral AmericanCentral American IndianCherokeeCheyenneChickasawChileanChineseChippewaChoctawColombianColvilleComancheCosta RicanCreeCreekCroatianCrowCubanCypriotCzechCzechoslovakianDanishDelawareDominicanDutchDutch West IndianEastern EuropeanEcuadorianEgyptianEnglishEstonianEthiopianEuropeanFijianFilipinoFinnishFrenchFrench American IndianFrench CanadianGermanGerman RussianGhanaianGreekGuamanian/ChamorroGuatemalanGuyaneseHaitianHmongHonduranHopiHoumaHungarianIcelanderIndian (Asian)IndonesianInupiatIranianIraqiIrishIroquoisIsraeliItalianJamaicanJapaneseJordanianKenyanKiowaKoreanLaotianLatvianLebaneseLiberianLithuanianLumbeeLuxembourgerMacedonianMalaysianMalteseMarshalleseMenomineeMexicanMexican American IndianMongolianMoroccanNative HawaiianNavajoNepaleseNew ZealanderNicaraguanNigerianNorthern EuropeanNorwegianOkinawanOsageOttawaPaiutePakistaniPalestinianPanamanianParaguayanPennsylvania GermanPeruvianPimaPolishPortuguesePotawatomiPuebloPuerto RicanPuget Sound SalishRomanianRussianSalvadoranSamoanScandinavianScotch-IrishScottishSeminoleSenegaleseSerbianShoshoneSierra LeoneanSiouxSlavicSlovakSloveneSomaliSouth AfricanSouth AmericanSouth American IndianSoviet UnionSpaniardSpanishSpanish AmericanSpanish American IndianSri LankanSubsaharan AfricanSudaneseSwedishSwissSyrianTaiwaneseThaiTlingit-HaidaTohono O'OdhamTonganTrinidadian and TobagonianTsimshianTurkishU.S. Virgin IslanderUgandanUkrainianUruguayanUteVenezuelanVietnameseWelshWest IndianYakamaYaquiYugoslavianYumanYup'ikZimbabwean
Immigration
NonimmigrantsImmigrantsAfghanistanAfricaAlbaniaArgentinaArmeniaAsiaAustraliaAustriaBahamasBangladeshBarbadosBelarusBelgiumBelizeBoliviaBosnia and HerzegovinaBrazilBulgariaBurma/MyanmarCabo VerdeCambodiaCameroonCanadaCaribbeanCentral AmericaChileChinaColombiaCongoCosta RicaCroatiaCubaCzechoslovakiaDenmarkDominicaDominican RepublicEastern AfricaEastern AsiaEastern EuropeEcuadorEgyptEl SalvadorEnglandEritreaEthiopiaEuropeFijiFranceGermanyGhanaGreeceGrenadaGuatemalaGuyanaHaitiHondurasHong KongHungaryIndiaIndonesiaIranIraqIrelandIsraelItalyJamaicaJapanJordanKazakhstanKenyaKoreaKuwaitLaosLatin AmericaLatviaLebanonLiberiaLithuaniaMalaysiaMexicoMicronesiaMiddle AfricaMoldovaMoroccoNepalNetherlandsNicaraguaNigeriaNorth AmericaNorth MacedoniaNorthern AfricaNorthern EuropeNorwayOceaniaPakistanPanamaPeruPhilippinesPolandPortugalRomaniaRussiaSaudi ArabiaScotlandSenegalSerbiaSierra LeoneSingaporeSomaliaSouth AfricaSouth AmericaSouth Central AsiaSouth Eastern AsiaSouthern EuropeSpainSri LankaSt. Vincent and the GrenadinesSudanSwedenSwitzerlandSyriaTaiwanThailandTrinidad and TobagoTurkeyUgandaUkraineUruguayUzbekistanVenezuelaVietnamWest IndiesWestern AfricaWestern AsiaYemenZaireZimbabweAzores
Ambulatory Disability
Income
Poverty
Unemployment
Labor Participation
Family Structure
Vehicle Availability
Education Level
Disability

Ambulatory Disability Comparison

Immigrants from Western Europe

Immigrants from Sudan

Fair
Exceptional
6.2%
AMBULATORY DISABILITY
31.6/ 100
METRIC RATING
192nd/ 347
METRIC RANK
5.8%
AMBULATORY DISABILITY
98.8/ 100
METRIC RATING
91st/ 347
METRIC RANK

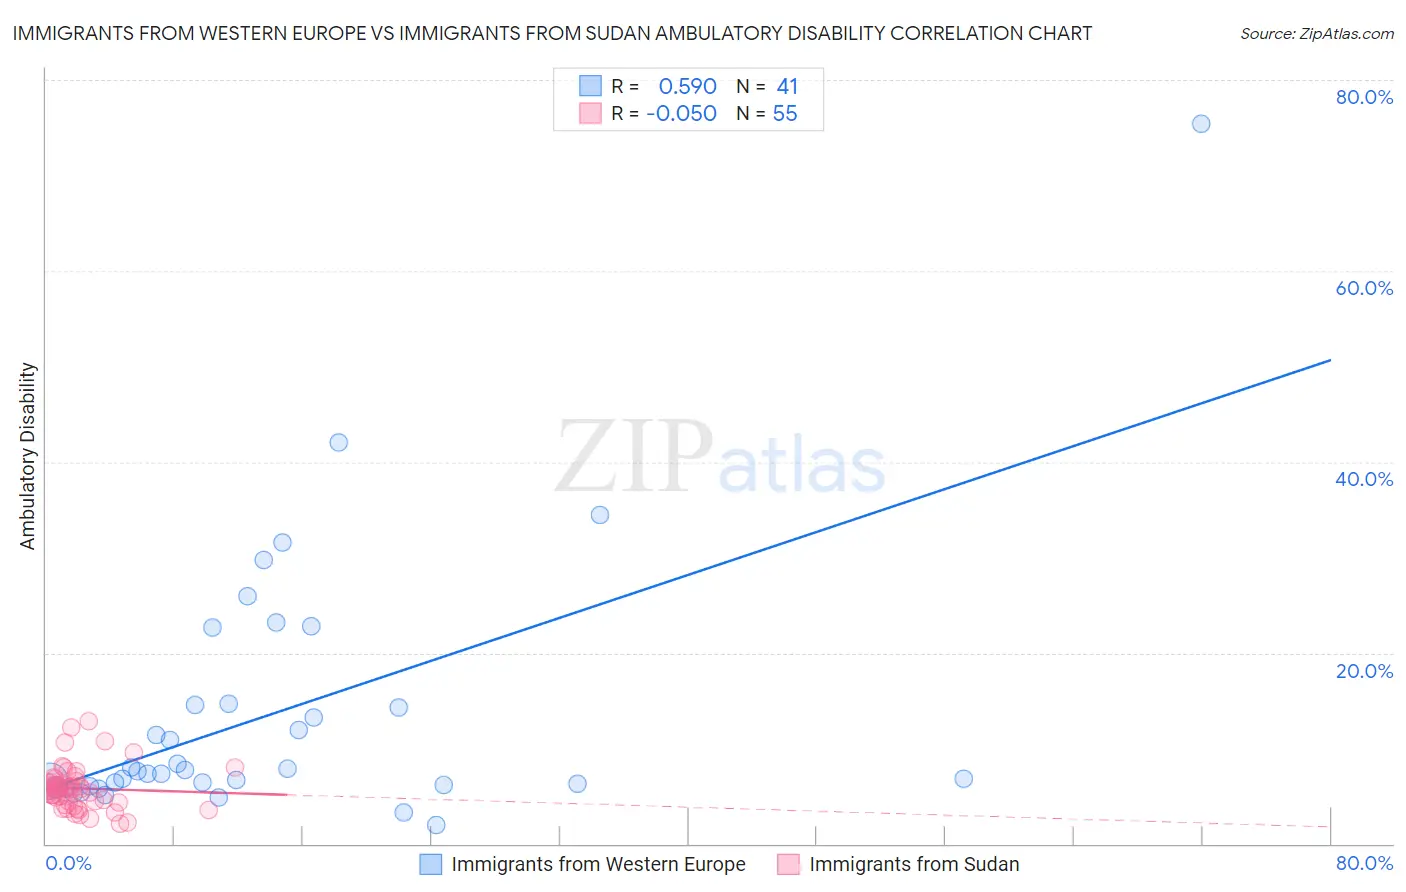
Immigrants from Western Europe vs Immigrants from Sudan Ambulatory Disability Correlation Chart

The statistical analysis conducted on geographies consisting of 493,880,740 people shows a substantial positive correlation between the proportion of Immigrants from Western Europe and percentage of population with ambulatory disability in the United States with a correlation coefficient (R) of 0.590 and weighted average of 6.2%. Similarly, the statistical analysis conducted on geographies consisting of 118,955,409 people shows a slight negative correlation between the proportion of Immigrants from Sudan and percentage of population with ambulatory disability in the United States with a correlation coefficient (R) of -0.050 and weighted average of 5.8%, a difference of 7.3%.
Immigrants from Western Europe vs Immigrants from Sudan Ambulatory Disability

Ambulatory Disability Correlation Summary

MeasurementImmigrants from Western EuropeImmigrants from Sudan
Minimum1.9%2.1%
Maximum75.4%12.8%
Range73.5%10.7%
Mean13.5%5.8%
Median7.6%5.7%
Interquartile 25% (IQ1)6.1%4.3%
Interquartile 75% (IQ3)14.6%6.6%
Interquartile Range (IQR)8.5%2.2%
Standard Deviation (Sample)13.7%2.3%
Standard Deviation (Population)13.5%2.2%

Similar Demographics by Ambulatory Disability

Demographics Similar to Immigrants from Western Europe by Ambulatory Disability

In terms of ambulatory disability, the demographic groups most similar to Immigrants from Western Europe are Immigrants from Guatemala (6.2%, a difference of 0.020%), Immigrants from Western Africa (6.2%, a difference of 0.10%), Guatemalan (6.2%, a difference of 0.10%), Alaska Native (6.2%, a difference of 0.11%), and Ukrainian (6.2%, a difference of 0.14%).
DemographicsRating | RankAmbulatory Disability
Immigrants | Bosnia and Herzegovina
37.2
/100
|
#185
Fair
6.2%
Europeans
36.2
/100
|
#186
Fair
6.2%
Carpatho Rusyns
35.3
/100
|
#187
Fair
6.2%
British
34.3
/100
|
#188
Fair
6.2%
Ukrainians
34.0
/100
|
#189
Fair
6.2%
Immigrants | Western Africa
33.4
/100
|
#190
Fair
6.2%
Immigrants | Guatemala
31.9
/100
|
#191
Fair
6.2%
Immigrants | Western Europe
31.6
/100
|
#192
Fair
6.2%
Guatemalans
30.0
/100
|
#193
Fair
6.2%
Alaska Natives
29.8
/100
|
#194
Fair
6.2%
Belgians
28.6
/100
|
#195
Fair
6.2%
Malaysians
28.2
/100
|
#196
Fair
6.2%
Poles
26.3
/100
|
#197
Fair
6.2%
Immigrants | Bangladesh
24.6
/100
|
#198
Fair
6.2%
Italians
22.6
/100
|
#199
Fair
6.2%

Demographics Similar to Immigrants from Sudan by Ambulatory Disability

In terms of ambulatory disability, the demographic groups most similar to Immigrants from Sudan are Bhutanese (5.8%, a difference of 0.0%), Australian (5.8%, a difference of 0.0%), Soviet Union (5.8%, a difference of 0.12%), Immigrants from Chile (5.8%, a difference of 0.17%), and Immigrants from Sierra Leone (5.8%, a difference of 0.17%).
DemographicsRating | RankAmbulatory Disability
Ugandans
99.2
/100
|
#84
Exceptional
5.7%
South Americans
99.0
/100
|
#85
Exceptional
5.7%
Latvians
99.0
/100
|
#86
Exceptional
5.7%
Immigrants | Chile
98.9
/100
|
#87
Exceptional
5.8%
Soviet Union
98.9
/100
|
#88
Exceptional
5.8%
Bhutanese
98.8
/100
|
#89
Exceptional
5.8%
Australians
98.8
/100
|
#90
Exceptional
5.8%
Immigrants | Sudan
98.8
/100
|
#91
Exceptional
5.8%
Immigrants | Sierra Leone
98.6
/100
|
#92
Exceptional
5.8%
Immigrants | Denmark
98.6
/100
|
#93
Exceptional
5.8%
Kenyans
98.4
/100
|
#94
Exceptional
5.8%
Immigrants | El Salvador
98.4
/100
|
#95
Exceptional
5.8%
Salvadorans
98.4
/100
|
#96
Exceptional
5.8%
Immigrants | Somalia
98.3
/100
|
#97
Exceptional
5.8%
Immigrants | Lebanon
98.3
/100
|
#98
Exceptional
5.8%