Immigrants from Western Asia vs Immigrants from Portugal Cognitive Disability
COMPARE
Immigrants from Western Asia
Immigrants from Portugal
Cognitive Disability
Cognitive Disability Comparison
Immigrants from Western Asia
Immigrants from Portugal
17.4%
COGNITIVE DISABILITY
29.5/ 100
METRIC RATING
189th/ 347
METRIC RANK
17.2%
COGNITIVE DISABILITY
61.8/ 100
METRIC RATING
169th/ 347
METRIC RANK
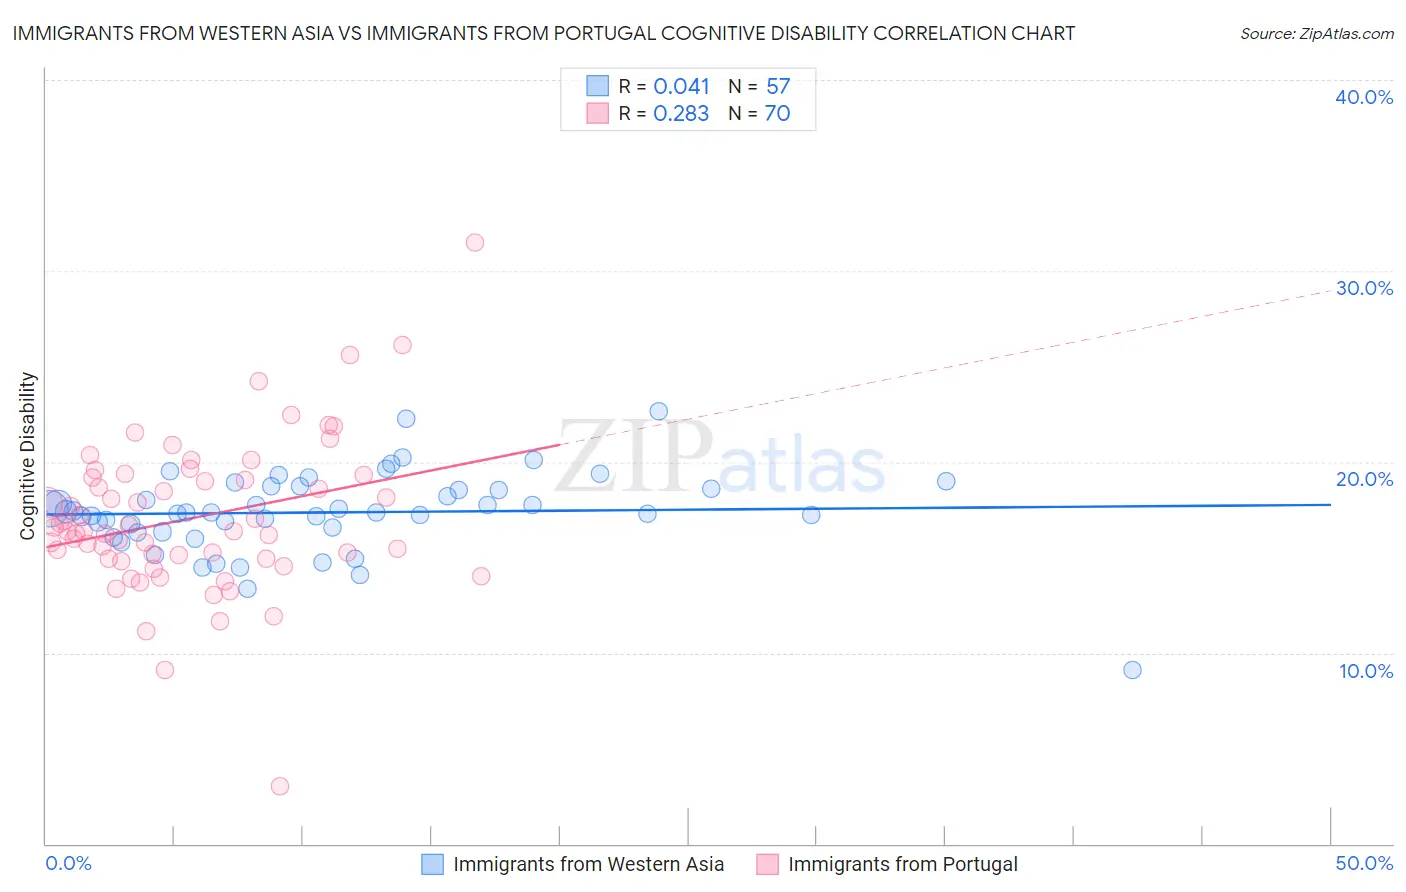
Immigrants from Western Asia vs Immigrants from Portugal Cognitive Disability Correlation Chart
The statistical analysis conducted on geographies consisting of 404,418,073 people shows no correlation between the proportion of Immigrants from Western Asia and percentage of population with cognitive disability in the United States with a correlation coefficient (R) of 0.041 and weighted average of 17.4%. Similarly, the statistical analysis conducted on geographies consisting of 174,785,813 people shows a weak positive correlation between the proportion of Immigrants from Portugal and percentage of population with cognitive disability in the United States with a correlation coefficient (R) of 0.283 and weighted average of 17.2%, a difference of 0.97%.
Cognitive Disability Correlation Summary
| Measurement | Immigrants from Western Asia | Immigrants from Portugal |
| Minimum | 9.1% | 3.0% |
| Maximum | 22.7% | 31.5% |
| Range | 13.6% | 28.5% |
| Mean | 17.4% | 17.0% |
| Median | 17.4% | 16.4% |
| Interquartile 25% (IQ1) | 16.5% | 15.0% |
| Interquartile 75% (IQ3) | 18.7% | 19.2% |
| Interquartile Range (IQR) | 2.2% | 4.3% |
| Standard Deviation (Sample) | 2.1% | 4.0% |
| Standard Deviation (Population) | 2.1% | 4.0% |
Demographics Similar to Immigrants from Western Asia and Immigrants from Portugal by Cognitive Disability
In terms of cognitive disability, the demographic groups most similar to Immigrants from Western Asia are Immigrants from France (17.4%, a difference of 0.010%), Immigrants from Fiji (17.4%, a difference of 0.14%), Cambodian (17.3%, a difference of 0.21%), Afghan (17.3%, a difference of 0.28%), and Crow (17.3%, a difference of 0.30%). Similarly, the demographic groups most similar to Immigrants from Portugal are Ecuadorian (17.2%, a difference of 0.070%), Tlingit-Haida (17.2%, a difference of 0.070%), Immigrants from Turkey (17.2%, a difference of 0.15%), Immigrants from Northern Africa (17.3%, a difference of 0.34%), and Laotian (17.3%, a difference of 0.34%).
| Demographics | Rating | Rank | Cognitive Disability |
| Immigrants | Portugal | 61.8 /100 | #169 | Good 17.2% |
| Ecuadorians | 59.6 /100 | #170 | Average 17.2% |
| Tlingit-Haida | 59.4 /100 | #171 | Average 17.2% |
| Immigrants | Turkey | 56.7 /100 | #172 | Average 17.2% |
| Immigrants | Northern Africa | 50.2 /100 | #173 | Average 17.3% |
| Laotians | 50.0 /100 | #174 | Average 17.3% |
| Tsimshian | 49.8 /100 | #175 | Average 17.3% |
| Shoshone | 49.2 /100 | #176 | Average 17.3% |
| Ute | 49.1 /100 | #177 | Average 17.3% |
| Spanish | 48.9 /100 | #178 | Average 17.3% |
| Sioux | 48.6 /100 | #179 | Average 17.3% |
| Pakistanis | 43.9 /100 | #180 | Average 17.3% |
| Immigrants | Guyana | 42.9 /100 | #181 | Average 17.3% |
| Arabs | 42.8 /100 | #182 | Average 17.3% |
| Spaniards | 40.3 /100 | #183 | Average 17.3% |
| Crow | 39.1 /100 | #184 | Fair 17.3% |
| Afghans | 38.2 /100 | #185 | Fair 17.3% |
| Cambodians | 35.9 /100 | #186 | Fair 17.3% |
| Immigrants | Fiji | 33.7 /100 | #187 | Fair 17.4% |
| Immigrants | France | 29.8 /100 | #188 | Fair 17.4% |
| Immigrants | Western Asia | 29.5 /100 | #189 | Fair 17.4% |