Immigrants from Western Asia vs Immigrants from Austria Vision Disability
COMPARE
Immigrants from Western Asia
Immigrants from Austria
Vision Disability
Vision Disability Comparison
Immigrants from Western Asia
Immigrants from Austria
2.0%
VISION DISABILITY
97.5/ 100
METRIC RATING
83rd/ 347
METRIC RANK
2.1%
VISION DISABILITY
94.4/ 100
METRIC RATING
103rd/ 347
METRIC RANK
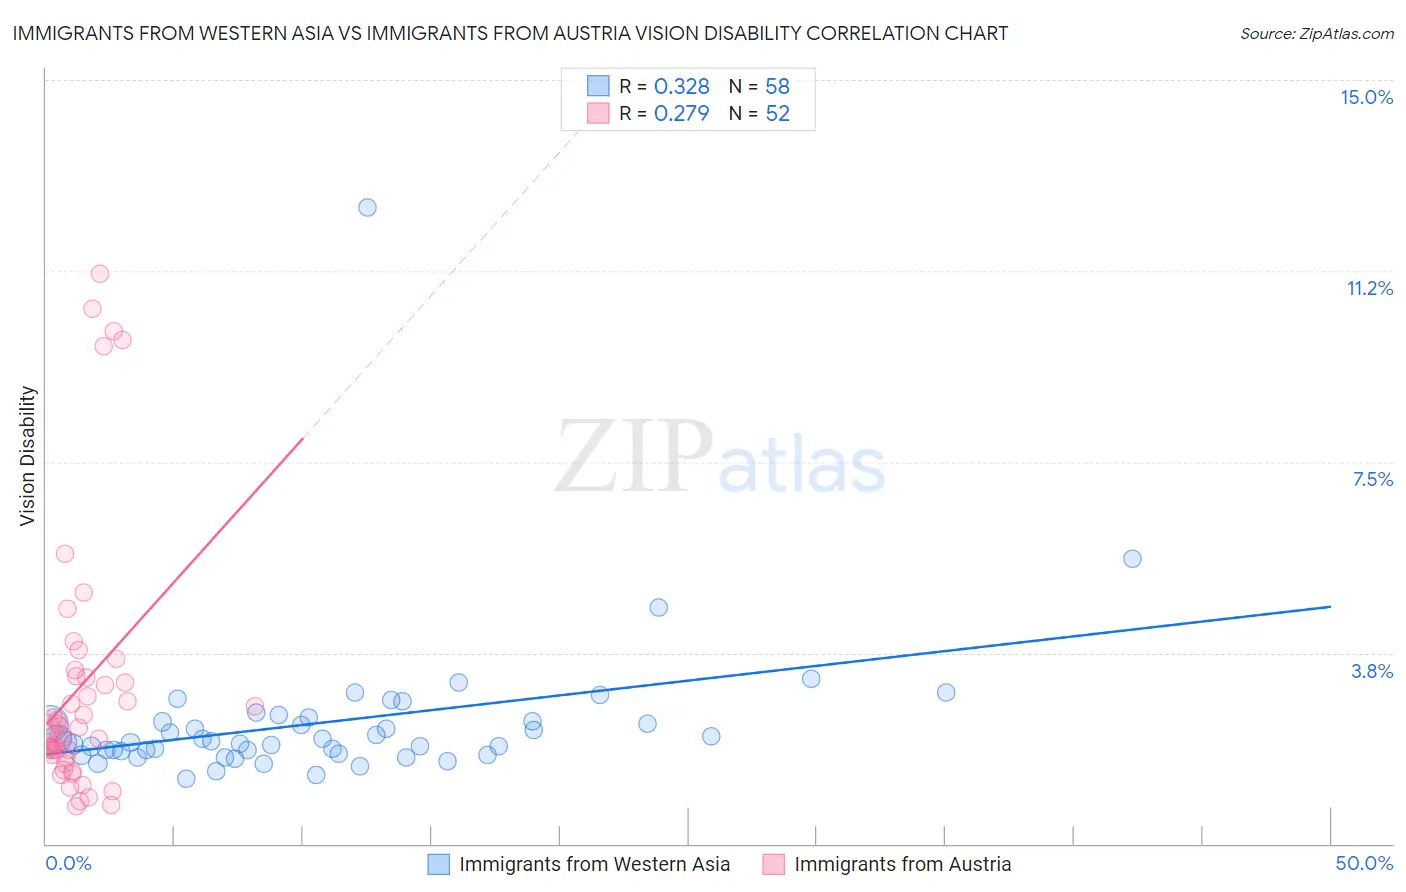
Immigrants from Western Asia vs Immigrants from Austria Vision Disability Correlation Chart
The statistical analysis conducted on geographies consisting of 404,140,331 people shows a mild positive correlation between the proportion of Immigrants from Western Asia and percentage of population with vision disability in the United States with a correlation coefficient (R) of 0.328 and weighted average of 2.0%. Similarly, the statistical analysis conducted on geographies consisting of 167,931,015 people shows a weak positive correlation between the proportion of Immigrants from Austria and percentage of population with vision disability in the United States with a correlation coefficient (R) of 0.279 and weighted average of 2.1%, a difference of 1.4%.
Vision Disability Correlation Summary
| Measurement | Immigrants from Western Asia | Immigrants from Austria |
| Minimum | 1.3% | 0.74% |
| Maximum | 12.5% | 11.2% |
| Range | 11.2% | 10.4% |
| Mean | 2.4% | 3.1% |
| Median | 2.0% | 2.3% |
| Interquartile 25% (IQ1) | 1.8% | 1.7% |
| Interquartile 75% (IQ3) | 2.4% | 3.3% |
| Interquartile Range (IQR) | 0.59% | 1.5% |
| Standard Deviation (Sample) | 1.5% | 2.6% |
| Standard Deviation (Population) | 1.5% | 2.6% |
Demographics Similar to Immigrants from Western Asia and Immigrants from Austria by Vision Disability
In terms of vision disability, the demographic groups most similar to Immigrants from Western Asia are Immigrants from Latvia (2.0%, a difference of 0.12%), Chinese (2.0%, a difference of 0.17%), Immigrants from Moldova (2.0%, a difference of 0.20%), Immigrants from Switzerland (2.0%, a difference of 0.26%), and Norwegian (2.0%, a difference of 0.27%). Similarly, the demographic groups most similar to Immigrants from Austria are Sri Lankan (2.1%, a difference of 0.14%), Albanian (2.1%, a difference of 0.17%), Greek (2.1%, a difference of 0.25%), Estonian (2.1%, a difference of 0.29%), and Immigrants from South Africa (2.1%, a difference of 0.36%).
| Demographics | Rating | Rank | Vision Disability |
| Immigrants | Western Asia | 97.5 /100 | #83 | Exceptional 2.0% |
| Immigrants | Latvia | 97.3 /100 | #84 | Exceptional 2.0% |
| Chinese | 97.2 /100 | #85 | Exceptional 2.0% |
| Immigrants | Moldova | 97.2 /100 | #86 | Exceptional 2.0% |
| Immigrants | Switzerland | 97.0 /100 | #87 | Exceptional 2.0% |
| Norwegians | 97.0 /100 | #88 | Exceptional 2.0% |
| Immigrants | Eastern Africa | 97.0 /100 | #89 | Exceptional 2.0% |
| Immigrants | Lebanon | 96.7 /100 | #90 | Exceptional 2.1% |
| Immigrants | Somalia | 96.2 /100 | #91 | Exceptional 2.1% |
| Immigrants | Syria | 96.2 /100 | #92 | Exceptional 2.1% |
| Immigrants | Europe | 96.1 /100 | #93 | Exceptional 2.1% |
| Immigrants | Croatia | 96.0 /100 | #94 | Exceptional 2.1% |
| Australians | 95.9 /100 | #95 | Exceptional 2.1% |
| Romanians | 95.7 /100 | #96 | Exceptional 2.1% |
| Immigrants | Afghanistan | 95.6 /100 | #97 | Exceptional 2.1% |
| Immigrants | South Africa | 95.4 /100 | #98 | Exceptional 2.1% |
| Estonians | 95.3 /100 | #99 | Exceptional 2.1% |
| Greeks | 95.1 /100 | #100 | Exceptional 2.1% |
| Albanians | 94.9 /100 | #101 | Exceptional 2.1% |
| Sri Lankans | 94.8 /100 | #102 | Exceptional 2.1% |
| Immigrants | Austria | 94.4 /100 | #103 | Exceptional 2.1% |