Immigrants from West Indies vs Immigrants from Italy Female Disability

COMPARE

Immigrants from West Indies
Race
Ancestry
AfghanAfricanAlaska NativeAlaskan AthabascanAlbanianAleutAlsatianAmericanApacheArabArapahoArgentineanArmenianAssyrian/Chaldean/SyriacAustralianAustrianBahamianBangladeshiBarbadianBasqueBelgianBelizeanBermudanBhutaneseBlackfeetBolivianBrazilianBritishBritish West IndianBulgarianBurmeseCajunCambodianCanadianCape VerdeanCarpatho RusynCelticCentral AmericanCentral American IndianCherokeeCheyenneChickasawChileanChineseChippewaChoctawColombianColvilleComancheCosta RicanCreeCreekCroatianCrowCubanCypriotCzechCzechoslovakianDanishDelawareDominicanDutchDutch West IndianEastern EuropeanEcuadorianEgyptianEnglishEstonianEthiopianEuropeanFijianFilipinoFinnishFrenchFrench American IndianFrench CanadianGermanGerman RussianGhanaianGreekGuamanian/ChamorroGuatemalanGuyaneseHaitianHmongHonduranHopiHoumaHungarianIcelanderIndian (Asian)IndonesianInupiatIranianIraqiIrishIroquoisIsraeliItalianJamaicanJapaneseJordanianKenyanKiowaKoreanLaotianLatvianLebaneseLiberianLithuanianLumbeeLuxembourgerMacedonianMalaysianMalteseMarshalleseMenomineeMexicanMexican American IndianMongolianMoroccanNative HawaiianNavajoNepaleseNew ZealanderNicaraguanNigerianNorthern EuropeanNorwegianOkinawanOsageOttawaPaiutePakistaniPalestinianPanamanianParaguayanPennsylvania GermanPeruvianPimaPolishPortuguesePotawatomiPuebloPuerto RicanPuget Sound SalishRomanianRussianSalvadoranSamoanScandinavianScotch-IrishScottishSeminoleSenegaleseSerbianShoshoneSierra LeoneanSiouxSlavicSlovakSloveneSomaliSouth AfricanSouth AmericanSouth American IndianSoviet UnionSpaniardSpanishSpanish AmericanSpanish American IndianSri LankanSubsaharan AfricanSudaneseSwedishSwissSyrianTaiwaneseThaiTlingit-HaidaTohono O'OdhamTonganTrinidadian and TobagonianTsimshianTurkishU.S. Virgin IslanderUgandanUkrainianUruguayanUteVenezuelanVietnameseWelshWest IndianYakamaYaquiYugoslavianYumanYup'ikZimbabwean
Immigration
NonimmigrantsImmigrantsAfghanistanAfricaAlbaniaArgentinaArmeniaAsiaAustraliaAustriaBahamasBangladeshBarbadosBelarusBelgiumBelizeBoliviaBosnia and HerzegovinaBrazilBulgariaBurma/MyanmarCabo VerdeCambodiaCameroonCanadaCaribbeanCentral AmericaChileChinaColombiaCongoCosta RicaCroatiaCubaCzechoslovakiaDenmarkDominicaDominican RepublicEastern AfricaEastern AsiaEastern EuropeEcuadorEgyptEl SalvadorEnglandEritreaEthiopiaEuropeFijiFranceGermanyGhanaGreeceGrenadaGuatemalaGuyanaHaitiHondurasHong KongHungaryIndiaIndonesiaIranIraqIrelandIsraelJamaicaJapanJordanKazakhstanKenyaKoreaKuwaitLaosLatin AmericaLatviaLebanonLiberiaLithuaniaMalaysiaMexicoMicronesiaMiddle AfricaMoldovaMoroccoNepalNetherlandsNicaraguaNigeriaNorth AmericaNorth MacedoniaNorthern AfricaNorthern EuropeNorwayOceaniaPakistanPanamaPeruPhilippinesPolandPortugalRomaniaRussiaSaudi ArabiaScotlandSenegalSerbiaSierra LeoneSingaporeSomaliaSouth AfricaSouth AmericaSouth Central AsiaSouth Eastern AsiaSouthern EuropeSpainSri LankaSt. Vincent and the GrenadinesSudanSwedenSwitzerlandSyriaTaiwanThailandTrinidad and TobagoTurkeyUgandaUkraineUruguayUzbekistanVenezuelaVietnamWest IndiesWestern AfricaWestern AsiaWestern EuropeYemenZaireZimbabweAzores
Immigrants from Italy
Race
Ancestry
AfghanAfricanAlaska NativeAlaskan AthabascanAlbanianAleutAlsatianAmericanApacheArabArapahoArgentineanArmenianAssyrian/Chaldean/SyriacAustralianAustrianBahamianBangladeshiBarbadianBasqueBelgianBelizeanBermudanBhutaneseBlackfeetBolivianBrazilianBritishBritish West IndianBulgarianBurmeseCajunCambodianCanadianCape VerdeanCarpatho RusynCelticCentral AmericanCentral American IndianCherokeeCheyenneChickasawChileanChineseChippewaChoctawColombianColvilleComancheCosta RicanCreeCreekCroatianCrowCubanCypriotCzechCzechoslovakianDanishDelawareDominicanDutchDutch West IndianEastern EuropeanEcuadorianEgyptianEnglishEstonianEthiopianEuropeanFijianFilipinoFinnishFrenchFrench American IndianFrench CanadianGermanGerman RussianGhanaianGreekGuamanian/ChamorroGuatemalanGuyaneseHaitianHmongHonduranHopiHoumaHungarianIcelanderIndian (Asian)IndonesianInupiatIranianIraqiIrishIroquoisIsraeliItalianJamaicanJapaneseJordanianKenyanKiowaKoreanLaotianLatvianLebaneseLiberianLithuanianLumbeeLuxembourgerMacedonianMalaysianMalteseMarshalleseMenomineeMexicanMexican American IndianMongolianMoroccanNative HawaiianNavajoNepaleseNew ZealanderNicaraguanNigerianNorthern EuropeanNorwegianOkinawanOsageOttawaPaiutePakistaniPalestinianPanamanianParaguayanPennsylvania GermanPeruvianPimaPolishPortuguesePotawatomiPuebloPuerto RicanPuget Sound SalishRomanianRussianSalvadoranSamoanScandinavianScotch-IrishScottishSeminoleSenegaleseSerbianShoshoneSierra LeoneanSiouxSlavicSlovakSloveneSomaliSouth AfricanSouth AmericanSouth American IndianSoviet UnionSpaniardSpanishSpanish AmericanSpanish American IndianSri LankanSubsaharan AfricanSudaneseSwedishSwissSyrianTaiwaneseThaiTlingit-HaidaTohono O'OdhamTonganTrinidadian and TobagonianTsimshianTurkishU.S. Virgin IslanderUgandanUkrainianUruguayanUteVenezuelanVietnameseWelshWest IndianYakamaYaquiYugoslavianYumanYup'ikZimbabwean
Immigration
NonimmigrantsImmigrantsAfghanistanAfricaAlbaniaArgentinaArmeniaAsiaAustraliaAustriaBahamasBangladeshBarbadosBelarusBelgiumBelizeBoliviaBosnia and HerzegovinaBrazilBulgariaBurma/MyanmarCabo VerdeCambodiaCameroonCanadaCaribbeanCentral AmericaChileChinaColombiaCongoCosta RicaCroatiaCubaCzechoslovakiaDenmarkDominicaDominican RepublicEastern AfricaEastern AsiaEastern EuropeEcuadorEgyptEl SalvadorEnglandEritreaEthiopiaEuropeFijiFranceGermanyGhanaGreeceGrenadaGuatemalaGuyanaHaitiHondurasHong KongHungaryIndiaIndonesiaIranIraqIrelandIsraelItalyJamaicaJapanJordanKazakhstanKenyaKoreaKuwaitLaosLatin AmericaLatviaLebanonLiberiaLithuaniaMalaysiaMexicoMicronesiaMiddle AfricaMoldovaMoroccoNepalNetherlandsNicaraguaNigeriaNorth AmericaNorth MacedoniaNorthern AfricaNorthern EuropeNorwayOceaniaPakistanPanamaPeruPhilippinesPolandPortugalRomaniaRussiaSaudi ArabiaScotlandSenegalSerbiaSierra LeoneSingaporeSomaliaSouth AfricaSouth AmericaSouth Central AsiaSouth Eastern AsiaSouthern EuropeSpainSri LankaSt. Vincent and the GrenadinesSudanSwedenSwitzerlandSyriaTaiwanThailandTrinidad and TobagoTurkeyUgandaUkraineUruguayUzbekistanVenezuelaVietnamWestern AfricaWestern AsiaWestern EuropeYemenZaireZimbabweAzores
Female Disability
Income
Poverty
Unemployment
Labor Participation
Family Structure
Vehicle Availability
Education Level
Disability

Female Disability Comparison

Immigrants from West Indies

Immigrants from Italy

Tragic
Exceptional
12.6%
FEMALE DISABILITY
4.4/ 100
METRIC RATING
236th/ 347
METRIC RANK
11.8%
FEMALE DISABILITY
96.4/ 100
METRIC RATING
125th/ 347
METRIC RANK

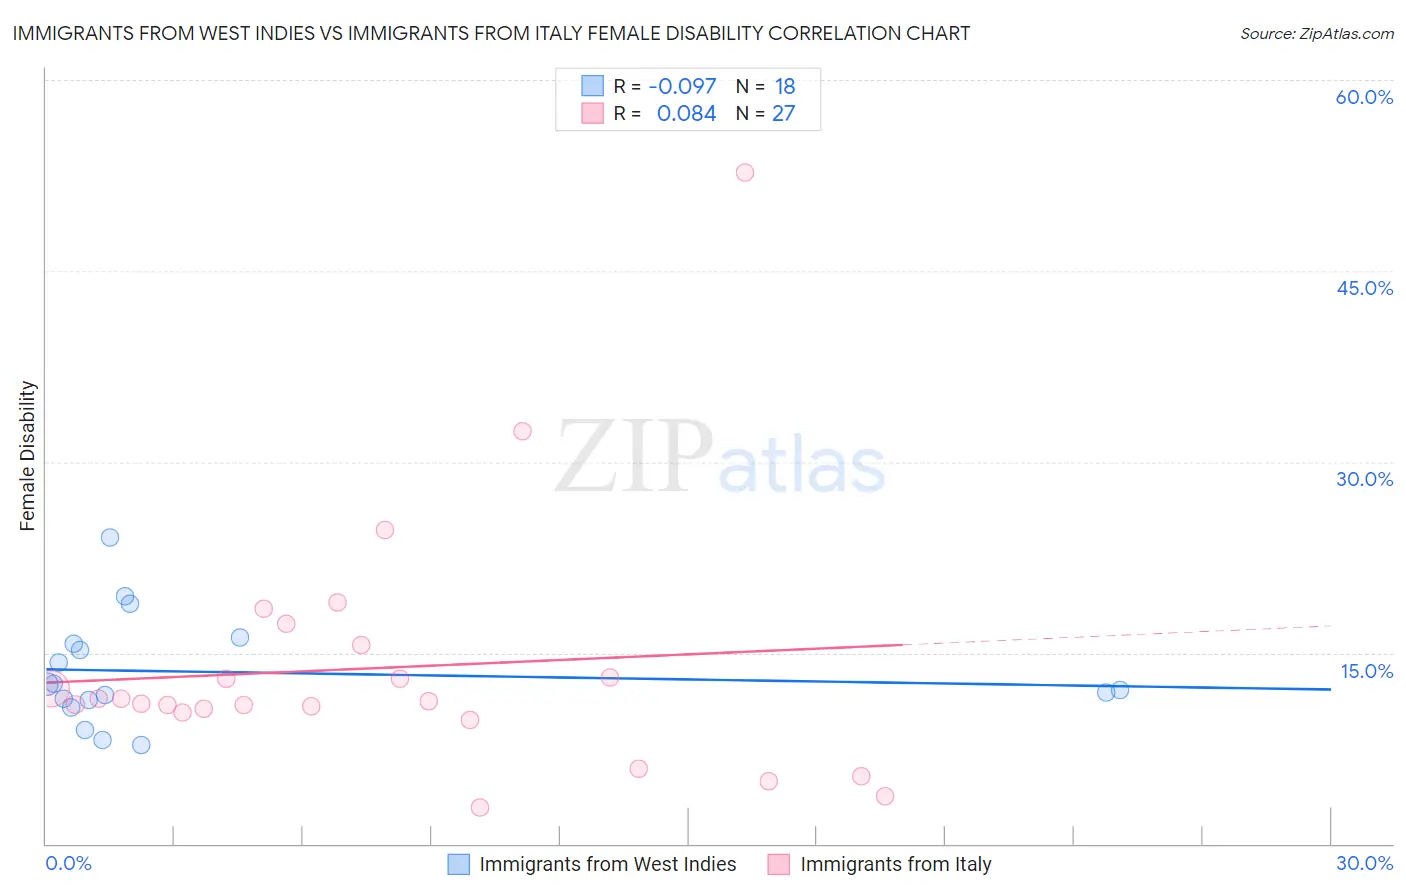
Immigrants from West Indies vs Immigrants from Italy Female Disability Correlation Chart

The statistical analysis conducted on geographies consisting of 72,456,124 people shows a slight negative correlation between the proportion of Immigrants from West Indies and percentage of females with a disability in the United States with a correlation coefficient (R) of -0.097 and weighted average of 12.6%. Similarly, the statistical analysis conducted on geographies consisting of 324,199,365 people shows a slight positive correlation between the proportion of Immigrants from Italy and percentage of females with a disability in the United States with a correlation coefficient (R) of 0.084 and weighted average of 11.8%, a difference of 6.2%.
Immigrants from West Indies vs Immigrants from Italy Female Disability

Female Disability Correlation Summary

MeasurementImmigrants from West IndiesImmigrants from Italy
Minimum7.8%2.9%
Maximum24.1%52.8%
Range16.3%49.9%
Mean13.5%13.8%
Median12.3%11.2%
Interquartile 25% (IQ1)11.3%10.3%
Interquartile 75% (IQ3)15.7%15.6%
Interquartile Range (IQR)4.4%5.3%
Standard Deviation (Sample)4.2%10.0%
Standard Deviation (Population)4.1%9.8%

Similar Demographics by Female Disability

Demographics Similar to Immigrants from West Indies by Female Disability

In terms of female disability, the demographic groups most similar to Immigrants from West Indies are Malaysian (12.5%, a difference of 0.13%), Slavic (12.6%, a difference of 0.13%), Yugoslavian (12.6%, a difference of 0.15%), Scandinavian (12.5%, a difference of 0.18%), and Immigrants from Iraq (12.5%, a difference of 0.19%).
DemographicsRating | RankFemale Disability
Hungarians
7.2
/100
|
#229
Tragic
12.5%
Immigrants | Belize
7.0
/100
|
#230
Tragic
12.5%
Belgians
6.5
/100
|
#231
Tragic
12.5%
Immigrants | Somalia
5.9
/100
|
#232
Tragic
12.5%
Immigrants | Iraq
5.3
/100
|
#233
Tragic
12.5%
Scandinavians
5.3
/100
|
#234
Tragic
12.5%
Malaysians
5.0
/100
|
#235
Tragic
12.5%
Immigrants | West Indies
4.4
/100
|
#236
Tragic
12.6%
Slavs
3.8
/100
|
#237
Tragic
12.6%
Yugoslavians
3.7
/100
|
#238
Tragic
12.6%
Barbadians
3.6
/100
|
#239
Tragic
12.6%
German Russians
3.2
/100
|
#240
Tragic
12.6%
Japanese
2.7
/100
|
#241
Tragic
12.6%
Canadians
2.6
/100
|
#242
Tragic
12.6%
Immigrants | Senegal
2.5
/100
|
#243
Tragic
12.6%

Demographics Similar to Immigrants from Italy by Female Disability

In terms of female disability, the demographic groups most similar to Immigrants from Italy are Russian (11.8%, a difference of 0.030%), Immigrants from Europe (11.8%, a difference of 0.060%), Immigrants from Croatia (11.8%, a difference of 0.070%), Immigrants from North Macedonia (11.8%, a difference of 0.13%), and Immigrants from Netherlands (11.8%, a difference of 0.14%).
DemographicsRating | RankFemale Disability
Immigrants | Nigeria
97.2
/100
|
#118
Exceptional
11.8%
Immigrants | Uganda
97.2
/100
|
#119
Exceptional
11.8%
Immigrants | Kazakhstan
97.0
/100
|
#120
Exceptional
11.8%
Immigrants | Netherlands
96.9
/100
|
#121
Exceptional
11.8%
Immigrants | North Macedonia
96.8
/100
|
#122
Exceptional
11.8%
Immigrants | Croatia
96.7
/100
|
#123
Exceptional
11.8%
Russians
96.5
/100
|
#124
Exceptional
11.8%
Immigrants | Italy
96.4
/100
|
#125
Exceptional
11.8%
Immigrants | Europe
96.2
/100
|
#126
Exceptional
11.8%
South American Indians
95.8
/100
|
#127
Exceptional
11.8%
Immigrants | Latvia
95.6
/100
|
#128
Exceptional
11.8%
Macedonians
95.5
/100
|
#129
Exceptional
11.8%
Nicaraguans
95.2
/100
|
#130
Exceptional
11.9%
Arabs
95.1
/100
|
#131
Exceptional
11.9%
Immigrants | Syria
94.6
/100
|
#132
Exceptional
11.9%