Immigrants from West Indies vs German Disability
COMPARE
Immigrants from West Indies
German
Disability
Disability Comparison
Immigrants from West Indies
Germans
11.9%
DISABILITY
21.1/ 100
METRIC RATING
190th/ 347
METRIC RANK
12.8%
DISABILITY
0.0/ 100
METRIC RATING
278th/ 347
METRIC RANK
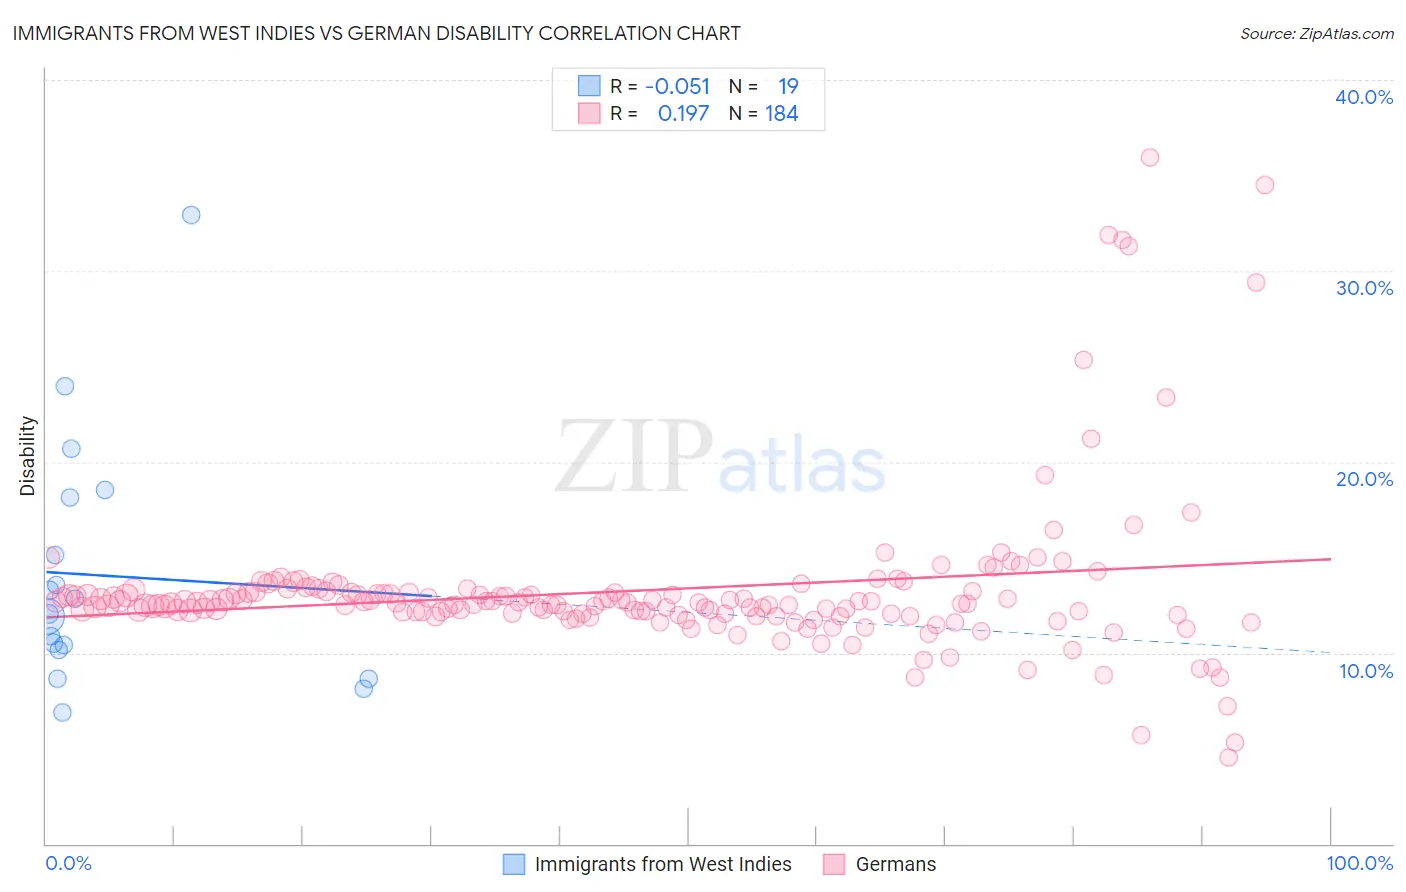
Immigrants from West Indies vs German Disability Correlation Chart
The statistical analysis conducted on geographies consisting of 72,456,461 people shows a slight negative correlation between the proportion of Immigrants from West Indies and percentage of population with a disability in the United States with a correlation coefficient (R) of -0.051 and weighted average of 11.9%. Similarly, the statistical analysis conducted on geographies consisting of 581,054,962 people shows a poor positive correlation between the proportion of Germans and percentage of population with a disability in the United States with a correlation coefficient (R) of 0.197 and weighted average of 12.8%, a difference of 8.0%.
Disability Correlation Summary
| Measurement | Immigrants from West Indies | German |
| Minimum | 6.9% | 4.5% |
| Maximum | 32.9% | 35.9% |
| Range | 26.0% | 31.4% |
| Mean | 14.1% | 13.3% |
| Median | 12.0% | 12.6% |
| Interquartile 25% (IQ1) | 10.1% | 12.0% |
| Interquartile 75% (IQ3) | 18.1% | 13.2% |
| Interquartile Range (IQR) | 8.0% | 1.2% |
| Standard Deviation (Sample) | 6.4% | 4.2% |
| Standard Deviation (Population) | 6.3% | 4.2% |
Similar Demographics by Disability
Demographics Similar to Immigrants from West Indies by Disability
In terms of disability, the demographic groups most similar to Immigrants from West Indies are Immigrants from Zaire (11.9%, a difference of 0.050%), Ute (11.9%, a difference of 0.11%), Lithuanian (11.9%, a difference of 0.16%), Immigrants from Mexico (11.9%, a difference of 0.17%), and Immigrants from Bosnia and Herzegovina (11.9%, a difference of 0.21%).
| Demographics | Rating | Rank | Disability |
| Hondurans | 31.2 /100 | #183 | Fair 11.8% |
| Iraqis | 30.0 /100 | #184 | Fair 11.8% |
| Immigrants | Burma/Myanmar | 28.5 /100 | #185 | Fair 11.8% |
| Immigrants | Scotland | 28.2 /100 | #186 | Fair 11.8% |
| Lebanese | 27.9 /100 | #187 | Fair 11.8% |
| Immigrants | Mexico | 23.8 /100 | #188 | Fair 11.9% |
| Immigrants | Zaire | 21.8 /100 | #189 | Fair 11.9% |
| Immigrants | West Indies | 21.1 /100 | #190 | Fair 11.9% |
| Ute | 19.5 /100 | #191 | Poor 11.9% |
| Lithuanians | 18.8 /100 | #192 | Poor 11.9% |
| Immigrants | Bosnia and Herzegovina | 18.0 /100 | #193 | Poor 11.9% |
| Somalis | 17.3 /100 | #194 | Poor 11.9% |
| Barbadians | 15.8 /100 | #195 | Poor 11.9% |
| Serbians | 15.4 /100 | #196 | Poor 11.9% |
| Immigrants | Belize | 15.2 /100 | #197 | Poor 11.9% |
Demographics Similar to Germans by Disability
In terms of disability, the demographic groups most similar to Germans are Fijian (12.8%, a difference of 0.090%), Spanish (12.8%, a difference of 0.15%), Dutch (12.8%, a difference of 0.17%), Hmong (12.8%, a difference of 0.22%), and Immigrants from Portugal (12.9%, a difference of 0.29%).
| Demographics | Rating | Rank | Disability |
| Immigrants | Yemen | 0.1 /100 | #271 | Tragic 12.6% |
| Dominicans | 0.0 /100 | #272 | Tragic 12.7% |
| Finns | 0.0 /100 | #273 | Tragic 12.7% |
| Nepalese | 0.0 /100 | #274 | Tragic 12.8% |
| Sioux | 0.0 /100 | #275 | Tragic 12.8% |
| Hmong | 0.0 /100 | #276 | Tragic 12.8% |
| Dutch | 0.0 /100 | #277 | Tragic 12.8% |
| Germans | 0.0 /100 | #278 | Tragic 12.8% |
| Fijians | 0.0 /100 | #279 | Tragic 12.8% |
| Spanish | 0.0 /100 | #280 | Tragic 12.8% |
| Immigrants | Portugal | 0.0 /100 | #281 | Tragic 12.9% |
| Scottish | 0.0 /100 | #282 | Tragic 12.9% |
| Irish | 0.0 /100 | #283 | Tragic 12.9% |
| Welsh | 0.0 /100 | #284 | Tragic 12.9% |
| Crow | 0.0 /100 | #285 | Tragic 12.9% |