Immigrants from Venezuela vs Kenyan Female Disability
COMPARE
Immigrants from Venezuela
Kenyan
Female Disability
Female Disability Comparison
Immigrants from Venezuela
Kenyans
10.9%
FEMALE DISABILITY
100.0/ 100
METRIC RATING
19th/ 347
METRIC RANK
11.9%
FEMALE DISABILITY
94.5/ 100
METRIC RATING
133rd/ 347
METRIC RANK
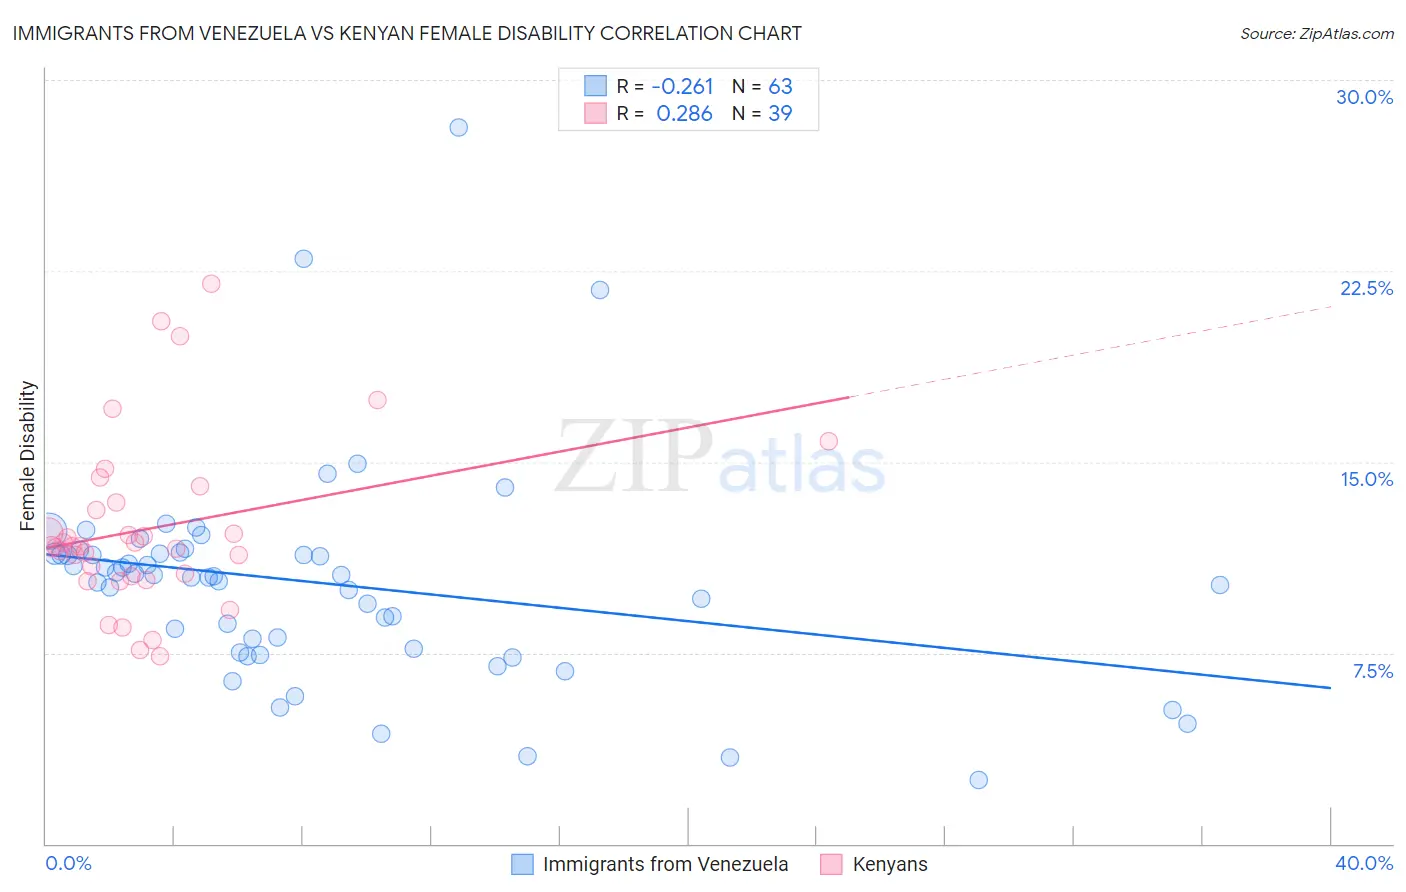
Immigrants from Venezuela vs Kenyan Female Disability Correlation Chart
The statistical analysis conducted on geographies consisting of 287,842,421 people shows a weak negative correlation between the proportion of Immigrants from Venezuela and percentage of females with a disability in the United States with a correlation coefficient (R) of -0.261 and weighted average of 10.9%. Similarly, the statistical analysis conducted on geographies consisting of 168,210,759 people shows a weak positive correlation between the proportion of Kenyans and percentage of females with a disability in the United States with a correlation coefficient (R) of 0.286 and weighted average of 11.9%, a difference of 9.3%.
Female Disability Correlation Summary
| Measurement | Immigrants from Venezuela | Kenyan |
| Minimum | 2.5% | 7.3% |
| Maximum | 28.1% | 22.0% |
| Range | 25.6% | 14.6% |
| Mean | 10.2% | 12.4% |
| Median | 10.5% | 11.7% |
| Interquartile 25% (IQ1) | 7.7% | 10.5% |
| Interquartile 75% (IQ3) | 11.4% | 13.4% |
| Interquartile Range (IQR) | 3.7% | 2.9% |
| Standard Deviation (Sample) | 4.2% | 3.3% |
| Standard Deviation (Population) | 4.2% | 3.3% |
Similar Demographics by Female Disability
Demographics Similar to Immigrants from Venezuela by Female Disability
In terms of female disability, the demographic groups most similar to Immigrants from Venezuela are Immigrants from Pakistan (10.9%, a difference of 0.17%), Immigrants from Iran (10.8%, a difference of 0.21%), Asian (10.9%, a difference of 0.54%), Indian (Asian) (10.8%, a difference of 0.60%), and Immigrants from Sri Lanka (10.9%, a difference of 0.66%).
| Demographics | Rating | Rank | Female Disability |
| Immigrants | Israel | 100.0 /100 | #12 | Exceptional 10.7% |
| Immigrants | Eastern Asia | 100.0 /100 | #13 | Exceptional 10.7% |
| Immigrants | China | 100.0 /100 | #14 | Exceptional 10.7% |
| Burmese | 100.0 /100 | #15 | Exceptional 10.7% |
| Okinawans | 100.0 /100 | #16 | Exceptional 10.8% |
| Indians (Asian) | 100.0 /100 | #17 | Exceptional 10.8% |
| Immigrants | Iran | 100.0 /100 | #18 | Exceptional 10.8% |
| Immigrants | Venezuela | 100.0 /100 | #19 | Exceptional 10.9% |
| Immigrants | Pakistan | 100.0 /100 | #20 | Exceptional 10.9% |
| Asians | 100.0 /100 | #21 | Exceptional 10.9% |
| Immigrants | Sri Lanka | 100.0 /100 | #22 | Exceptional 10.9% |
| Venezuelans | 100.0 /100 | #23 | Exceptional 11.0% |
| Immigrants | Argentina | 100.0 /100 | #24 | Exceptional 11.0% |
| Immigrants | Asia | 100.0 /100 | #25 | Exceptional 11.0% |
| Argentineans | 100.0 /100 | #26 | Exceptional 11.0% |
Demographics Similar to Kenyans by Female Disability
In terms of female disability, the demographic groups most similar to Kenyans are Immigrants from Nicaragua (11.9%, a difference of 0.0%), Immigrants from Syria (11.9%, a difference of 0.010%), Central American (11.9%, a difference of 0.070%), Ugandan (11.9%, a difference of 0.090%), and Arab (11.9%, a difference of 0.11%).
| Demographics | Rating | Rank | Female Disability |
| Immigrants | Europe | 96.2 /100 | #126 | Exceptional 11.8% |
| South American Indians | 95.8 /100 | #127 | Exceptional 11.8% |
| Immigrants | Latvia | 95.6 /100 | #128 | Exceptional 11.8% |
| Macedonians | 95.5 /100 | #129 | Exceptional 11.8% |
| Nicaraguans | 95.2 /100 | #130 | Exceptional 11.9% |
| Arabs | 95.1 /100 | #131 | Exceptional 11.9% |
| Immigrants | Syria | 94.6 /100 | #132 | Exceptional 11.9% |
| Kenyans | 94.5 /100 | #133 | Exceptional 11.9% |
| Immigrants | Nicaragua | 94.5 /100 | #134 | Exceptional 11.9% |
| Central Americans | 94.2 /100 | #135 | Exceptional 11.9% |
| Ugandans | 94.0 /100 | #136 | Exceptional 11.9% |
| Immigrants | Norway | 93.8 /100 | #137 | Exceptional 11.9% |
| Ecuadorians | 93.4 /100 | #138 | Exceptional 11.9% |
| Immigrants | Hungary | 92.8 /100 | #139 | Exceptional 11.9% |
| Romanians | 91.6 /100 | #140 | Exceptional 11.9% |