Immigrants from Taiwan vs Comanche Disability Age 35 to 64

COMPARE

Immigrants from Taiwan
Race
Ancestry
AfghanAfricanAlaska NativeAlaskan AthabascanAlbanianAleutAlsatianAmericanApacheArabArapahoArgentineanArmenianAssyrian/Chaldean/SyriacAustralianAustrianBahamianBangladeshiBarbadianBasqueBelgianBelizeanBermudanBhutaneseBlackfeetBolivianBrazilianBritishBritish West IndianBulgarianBurmeseCajunCambodianCanadianCape VerdeanCarpatho RusynCelticCentral AmericanCentral American IndianCherokeeCheyenneChickasawChileanChineseChippewaChoctawColombianColvilleCosta RicanCreeCreekCroatianCrowCubanCypriotCzechCzechoslovakianDanishDelawareDominicanDutchDutch West IndianEastern EuropeanEcuadorianEgyptianEnglishEstonianEthiopianEuropeanFijianFilipinoFinnishFrenchFrench American IndianFrench CanadianGermanGerman RussianGhanaianGreekGuamanian/ChamorroGuatemalanGuyaneseHaitianHmongHonduranHopiHoumaHungarianIcelanderIndian (Asian)IndonesianInupiatIranianIraqiIrishIroquoisIsraeliItalianJamaicanJapaneseJordanianKenyanKiowaKoreanLaotianLatvianLebaneseLiberianLithuanianLumbeeLuxembourgerMacedonianMalaysianMalteseMarshalleseMenomineeMexicanMexican American IndianMongolianMoroccanNative HawaiianNavajoNepaleseNew ZealanderNicaraguanNigerianNorthern EuropeanNorwegianOkinawanOsageOttawaPaiutePakistaniPalestinianPanamanianParaguayanPennsylvania GermanPeruvianPimaPolishPortuguesePotawatomiPuebloPuerto RicanPuget Sound SalishRomanianRussianSalvadoranSamoanScandinavianScotch-IrishScottishSeminoleSenegaleseSerbianShoshoneSierra LeoneanSiouxSlavicSlovakSloveneSomaliSouth AfricanSouth AmericanSouth American IndianSoviet UnionSpaniardSpanishSpanish AmericanSpanish American IndianSri LankanSubsaharan AfricanSudaneseSwedishSwissSyrianTaiwaneseThaiTlingit-HaidaTohono O'OdhamTonganTrinidadian and TobagonianTsimshianTurkishU.S. Virgin IslanderUgandanUkrainianUruguayanUteVenezuelanVietnameseWelshWest IndianYakamaYaquiYugoslavianYumanYup'ikZimbabwean
Immigration
NonimmigrantsImmigrantsAfghanistanAfricaAlbaniaArgentinaArmeniaAsiaAustraliaAustriaBahamasBangladeshBarbadosBelarusBelgiumBelizeBoliviaBosnia and HerzegovinaBrazilBulgariaBurma/MyanmarCabo VerdeCambodiaCameroonCanadaCaribbeanCentral AmericaChileChinaColombiaCongoCosta RicaCroatiaCubaCzechoslovakiaDenmarkDominicaDominican RepublicEastern AfricaEastern AsiaEastern EuropeEcuadorEgyptEl SalvadorEnglandEritreaEthiopiaEuropeFijiFranceGermanyGhanaGreeceGrenadaGuatemalaGuyanaHaitiHondurasHong KongHungaryIndiaIndonesiaIranIraqIrelandIsraelItalyJamaicaJapanJordanKazakhstanKenyaKoreaKuwaitLaosLatin AmericaLatviaLebanonLiberiaLithuaniaMalaysiaMexicoMicronesiaMiddle AfricaMoldovaMoroccoNepalNetherlandsNicaraguaNigeriaNorth AmericaNorth MacedoniaNorthern AfricaNorthern EuropeNorwayOceaniaPakistanPanamaPeruPhilippinesPolandPortugalRomaniaRussiaSaudi ArabiaScotlandSenegalSerbiaSierra LeoneSingaporeSomaliaSouth AfricaSouth AmericaSouth Central AsiaSouth Eastern AsiaSouthern EuropeSpainSri LankaSt. Vincent and the GrenadinesSudanSwedenSwitzerlandSyriaTaiwanThailandTrinidad and TobagoTurkeyUgandaUkraineUruguayUzbekistanVenezuelaVietnamWest IndiesWestern AfricaWestern AsiaWestern EuropeYemenZaireZimbabweAzores
Comanche
Race
Ancestry
AfghanAfricanAlaska NativeAlaskan AthabascanAlbanianAleutAlsatianAmericanApacheArabArapahoArgentineanArmenianAssyrian/Chaldean/SyriacAustralianAustrianBahamianBangladeshiBarbadianBasqueBelgianBelizeanBermudanBhutaneseBlackfeetBolivianBrazilianBritishBritish West IndianBulgarianBurmeseCajunCambodianCanadianCape VerdeanCarpatho RusynCelticCentral AmericanCentral American IndianCherokeeCheyenneChickasawChileanChineseChippewaChoctawColombianColvilleComancheCosta RicanCreeCreekCroatianCrowCubanCypriotCzechCzechoslovakianDanishDelawareDominicanDutchDutch West IndianEastern EuropeanEcuadorianEgyptianEnglishEstonianEthiopianEuropeanFijianFilipinoFinnishFrenchFrench American IndianFrench CanadianGermanGerman RussianGhanaianGreekGuamanian/ChamorroGuatemalanGuyaneseHaitianHmongHonduranHopiHoumaHungarianIcelanderIndian (Asian)IndonesianInupiatIranianIraqiIrishIroquoisIsraeliItalianJamaicanJapaneseJordanianKenyanKiowaKoreanLaotianLatvianLebaneseLiberianLithuanianLumbeeLuxembourgerMacedonianMalaysianMalteseMarshalleseMenomineeMexicanMexican American IndianMongolianMoroccanNative HawaiianNavajoNepaleseNew ZealanderNicaraguanNigerianNorthern EuropeanNorwegianOkinawanOsageOttawaPaiutePakistaniPalestinianPanamanianParaguayanPennsylvania GermanPeruvianPimaPolishPortuguesePotawatomiPuebloPuerto RicanPuget Sound SalishRomanianRussianSalvadoranSamoanScandinavianScotch-IrishScottishSeminoleSenegaleseSerbianShoshoneSierra LeoneanSiouxSlavicSlovakSloveneSomaliSouth AfricanSouth AmericanSouth American IndianSoviet UnionSpaniardSpanishSpanish AmericanSpanish American IndianSri LankanSubsaharan AfricanSudaneseSwedishSwissSyrianTaiwaneseThaiTlingit-HaidaTohono O'OdhamTonganTrinidadian and TobagonianTsimshianTurkishU.S. Virgin IslanderUgandanUkrainianUruguayanUteVenezuelanVietnameseWelshWest IndianYakamaYaquiYugoslavianYumanYup'ikZimbabwean
Immigration
NonimmigrantsImmigrantsAfghanistanAfricaAlbaniaArgentinaArmeniaAsiaAustraliaAustriaBahamasBangladeshBarbadosBelarusBelgiumBelizeBoliviaBosnia and HerzegovinaBrazilBulgariaBurma/MyanmarCabo VerdeCambodiaCameroonCanadaCaribbeanCentral AmericaChileChinaColombiaCongoCosta RicaCroatiaCubaCzechoslovakiaDenmarkDominicaDominican RepublicEastern AfricaEastern AsiaEastern EuropeEcuadorEgyptEl SalvadorEnglandEritreaEthiopiaEuropeFijiFranceGermanyGhanaGreeceGrenadaGuatemalaGuyanaHaitiHondurasHong KongHungaryIndiaIndonesiaIranIraqIrelandIsraelItalyJamaicaJapanJordanKazakhstanKenyaKoreaKuwaitLaosLatin AmericaLatviaLebanonLiberiaLithuaniaMalaysiaMexicoMicronesiaMiddle AfricaMoldovaMoroccoNepalNetherlandsNicaraguaNigeriaNorth AmericaNorth MacedoniaNorthern AfricaNorthern EuropeNorwayOceaniaPakistanPanamaPeruPhilippinesPolandPortugalRomaniaRussiaSaudi ArabiaScotlandSenegalSerbiaSierra LeoneSingaporeSomaliaSouth AfricaSouth AmericaSouth Central AsiaSouth Eastern AsiaSouthern EuropeSpainSri LankaSt. Vincent and the GrenadinesSudanSwedenSwitzerlandSyriaThailandTrinidad and TobagoTurkeyUgandaUkraineUruguayUzbekistanVenezuelaVietnamWest IndiesWestern AfricaWestern AsiaWestern EuropeYemenZaireZimbabweAzores
Disability Age 35 to 64
Income
Poverty
Unemployment
Labor Participation
Family Structure
Vehicle Availability
Education Level
Disability

Disability Age 35 to 64 Comparison

Immigrants from Taiwan

Comanche

Exceptional
Tragic
7.8%
DISABILITY AGE 35 TO 64
100.0/ 100
METRIC RATING
1st/ 347
METRIC RANK
14.7%
DISABILITY AGE 35 TO 64
0.0/ 100
METRIC RATING
321st/ 347
METRIC RANK

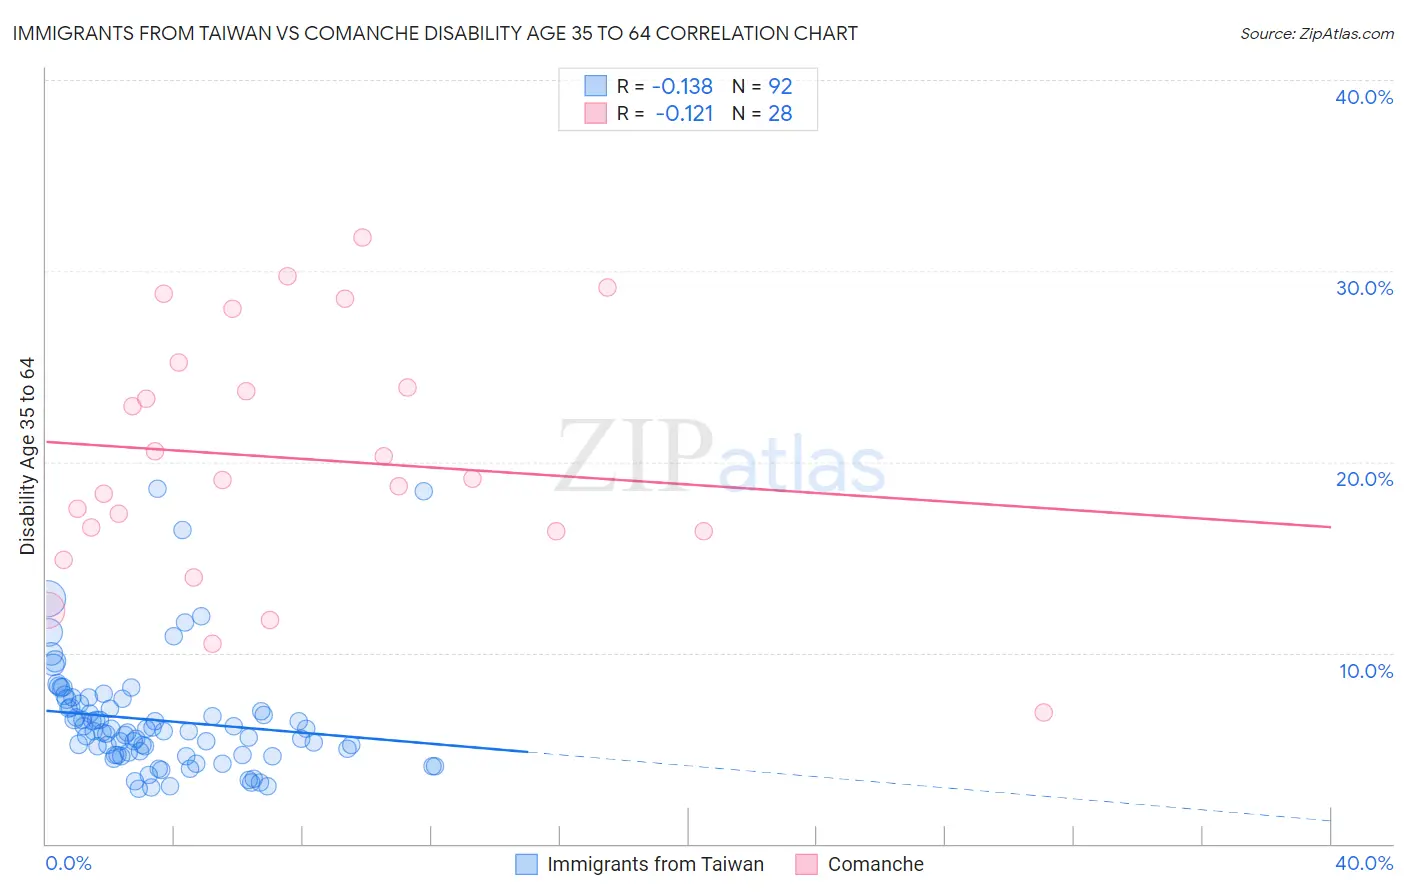
Immigrants from Taiwan vs Comanche Disability Age 35 to 64 Correlation Chart

The statistical analysis conducted on geographies consisting of 298,104,424 people shows a poor negative correlation between the proportion of Immigrants from Taiwan and percentage of population with a disability between the ages 34 and 64 in the United States with a correlation coefficient (R) of -0.138 and weighted average of 7.8%. Similarly, the statistical analysis conducted on geographies consisting of 109,769,309 people shows a poor negative correlation between the proportion of Comanche and percentage of population with a disability between the ages 34 and 64 in the United States with a correlation coefficient (R) of -0.121 and weighted average of 14.7%, a difference of 87.9%.
Immigrants from Taiwan vs Comanche Disability Age 35 to 64

Disability Age 35 to 64 Correlation Summary

MeasurementImmigrants from TaiwanComanche
Minimum2.9%6.9%
Maximum18.6%31.7%
Range15.7%24.8%
Mean6.5%20.2%
Median5.9%19.1%
Interquartile 25% (IQ1)4.7%16.4%
Interquartile 75% (IQ3)7.2%24.6%
Interquartile Range (IQR)2.5%8.2%
Standard Deviation (Sample)2.9%6.4%
Standard Deviation (Population)2.9%6.3%

Similar Demographics by Disability Age 35 to 64

Demographics Similar to Immigrants from Taiwan by Disability Age 35 to 64

In terms of disability age 35 to 64, the demographic groups most similar to Immigrants from Taiwan are Filipino (8.0%, a difference of 2.5%), Immigrants from Hong Kong (8.2%, a difference of 4.4%), Immigrants from India (8.3%, a difference of 5.5%), Immigrants from Iran (8.5%, a difference of 8.2%), and Thai (8.6%, a difference of 9.2%).
DemographicsRating | RankDisability Age 35 to 64
Immigrants | Taiwan
100.0
/100
|
#1
Exceptional
7.8%
Filipinos
100.0
/100
|
#2
Exceptional
8.0%
Immigrants | Hong Kong
100.0
/100
|
#3
Exceptional
8.2%
Immigrants | India
100.0
/100
|
#4
Exceptional
8.3%
Immigrants | Iran
100.0
/100
|
#5
Exceptional
8.5%
Thais
100.0
/100
|
#6
Exceptional
8.6%
Immigrants | Israel
100.0
/100
|
#7
Exceptional
8.6%
Iranians
100.0
/100
|
#8
Exceptional
8.7%
Immigrants | China
100.0
/100
|
#9
Exceptional
8.7%
Immigrants | Bolivia
100.0
/100
|
#10
Exceptional
8.7%
Immigrants | Eastern Asia
100.0
/100
|
#11
Exceptional
8.8%
Indians (Asian)
100.0
/100
|
#12
Exceptional
8.9%
Immigrants | South Central Asia
100.0
/100
|
#13
Exceptional
8.9%
Immigrants | Singapore
100.0
/100
|
#14
Exceptional
8.9%
Bolivians
100.0
/100
|
#15
Exceptional
8.9%

Demographics Similar to Comanche by Disability Age 35 to 64

In terms of disability age 35 to 64, the demographic groups most similar to Comanche are Potawatomi (14.8%, a difference of 0.040%), Black/African American (14.7%, a difference of 0.26%), Immigrants from Cabo Verde (14.7%, a difference of 0.41%), Ottawa (14.6%, a difference of 0.83%), and Crow (14.6%, a difference of 0.90%).
DemographicsRating | RankDisability Age 35 to 64
Shoshone
0.0
/100
|
#314
Tragic
14.5%
Alaska Natives
0.0
/100
|
#315
Tragic
14.5%
Osage
0.0
/100
|
#316
Tragic
14.5%
Crow
0.0
/100
|
#317
Tragic
14.6%
Ottawa
0.0
/100
|
#318
Tragic
14.6%
Immigrants | Cabo Verde
0.0
/100
|
#319
Tragic
14.7%
Blacks/African Americans
0.0
/100
|
#320
Tragic
14.7%
Comanche
0.0
/100
|
#321
Tragic
14.7%
Potawatomi
0.0
/100
|
#322
Tragic
14.8%
Apache
0.0
/100
|
#323
Tragic
14.9%
Chippewa
0.0
/100
|
#324
Tragic
15.0%
Arapaho
0.0
/100
|
#325
Tragic
15.1%
Natives/Alaskans
0.0
/100
|
#326
Tragic
15.3%
Pueblo
0.0
/100
|
#327
Tragic
15.3%
Cajuns
0.0
/100
|
#328
Tragic
15.3%