Immigrants from Sweden vs Aleut Disability Age 35 to 64

COMPARE

Immigrants from Sweden
Race
Ancestry
AfghanAfricanAlaska NativeAlaskan AthabascanAlbanianAlsatianAmericanApacheArabArapahoArgentineanArmenianAssyrian/Chaldean/SyriacAustralianAustrianBahamianBangladeshiBarbadianBasqueBelgianBelizeanBermudanBhutaneseBlackfeetBolivianBrazilianBritishBritish West IndianBulgarianBurmeseCajunCambodianCanadianCape VerdeanCarpatho RusynCelticCentral AmericanCentral American IndianCherokeeCheyenneChickasawChileanChineseChippewaChoctawColombianColvilleComancheCosta RicanCreeCreekCroatianCrowCubanCypriotCzechCzechoslovakianDanishDelawareDominicanDutchDutch West IndianEastern EuropeanEcuadorianEgyptianEnglishEstonianEthiopianEuropeanFijianFilipinoFinnishFrenchFrench American IndianFrench CanadianGermanGerman RussianGhanaianGreekGuamanian/ChamorroGuatemalanGuyaneseHaitianHmongHonduranHopiHoumaHungarianIcelanderIndian (Asian)IndonesianInupiatIranianIraqiIrishIroquoisIsraeliItalianJamaicanJapaneseJordanianKenyanKiowaKoreanLaotianLatvianLebaneseLiberianLithuanianLumbeeLuxembourgerMacedonianMalaysianMalteseMarshalleseMenomineeMexicanMexican American IndianMongolianMoroccanNative HawaiianNavajoNepaleseNew ZealanderNicaraguanNigerianNorthern EuropeanNorwegianOkinawanOsageOttawaPaiutePakistaniPalestinianPanamanianParaguayanPennsylvania GermanPeruvianPimaPolishPortuguesePotawatomiPuebloPuerto RicanPuget Sound SalishRomanianRussianSalvadoranSamoanScandinavianScotch-IrishScottishSeminoleSenegaleseSerbianShoshoneSierra LeoneanSiouxSlavicSlovakSloveneSomaliSouth AfricanSouth AmericanSouth American IndianSoviet UnionSpaniardSpanishSpanish AmericanSpanish American IndianSri LankanSubsaharan AfricanSudaneseSwedishSwissSyrianTaiwaneseThaiTlingit-HaidaTohono O'OdhamTonganTrinidadian and TobagonianTsimshianTurkishU.S. Virgin IslanderUgandanUkrainianUruguayanUteVenezuelanVietnameseWelshWest IndianYakamaYaquiYugoslavianYumanYup'ikZimbabwean
Immigration
NonimmigrantsImmigrantsAfghanistanAfricaAlbaniaArgentinaArmeniaAsiaAustraliaAustriaBahamasBangladeshBarbadosBelarusBelgiumBelizeBoliviaBosnia and HerzegovinaBrazilBulgariaBurma/MyanmarCabo VerdeCambodiaCameroonCanadaCaribbeanCentral AmericaChileChinaColombiaCongoCosta RicaCroatiaCubaCzechoslovakiaDenmarkDominicaDominican RepublicEastern AfricaEastern AsiaEastern EuropeEcuadorEgyptEl SalvadorEnglandEritreaEthiopiaEuropeFijiFranceGermanyGhanaGreeceGrenadaGuatemalaGuyanaHaitiHondurasHong KongHungaryIndiaIndonesiaIranIraqIrelandIsraelItalyJamaicaJapanJordanKazakhstanKenyaKoreaKuwaitLaosLatin AmericaLatviaLebanonLiberiaLithuaniaMalaysiaMexicoMicronesiaMiddle AfricaMoldovaMoroccoNepalNetherlandsNicaraguaNigeriaNorth AmericaNorth MacedoniaNorthern AfricaNorthern EuropeNorwayOceaniaPakistanPanamaPeruPhilippinesPolandPortugalRomaniaRussiaSaudi ArabiaScotlandSenegalSerbiaSierra LeoneSingaporeSomaliaSouth AfricaSouth AmericaSouth Central AsiaSouth Eastern AsiaSouthern EuropeSpainSri LankaSt. Vincent and the GrenadinesSudanSwedenSwitzerlandSyriaTaiwanThailandTrinidad and TobagoTurkeyUgandaUkraineUruguayUzbekistanVenezuelaVietnamWest IndiesWestern AfricaWestern AsiaWestern EuropeYemenZaireZimbabweAzores
Aleut
Race
Ancestry
AfghanAfricanAlaska NativeAlaskan AthabascanAlbanianAleutAlsatianAmericanApacheArabArapahoArgentineanArmenianAssyrian/Chaldean/SyriacAustralianAustrianBahamianBangladeshiBarbadianBasqueBelgianBelizeanBermudanBhutaneseBlackfeetBolivianBrazilianBritishBritish West IndianBulgarianBurmeseCajunCambodianCanadianCape VerdeanCarpatho RusynCelticCentral AmericanCentral American IndianCherokeeCheyenneChickasawChileanChineseChippewaChoctawColombianColvilleComancheCosta RicanCreeCreekCroatianCrowCubanCypriotCzechCzechoslovakianDanishDelawareDominicanDutchDutch West IndianEastern EuropeanEcuadorianEgyptianEnglishEstonianEthiopianEuropeanFijianFilipinoFinnishFrenchFrench American IndianFrench CanadianGermanGerman RussianGhanaianGreekGuamanian/ChamorroGuatemalanGuyaneseHaitianHmongHonduranHopiHoumaHungarianIcelanderIndian (Asian)IndonesianInupiatIranianIraqiIrishIroquoisIsraeliItalianJamaicanJapaneseJordanianKenyanKiowaKoreanLaotianLatvianLebaneseLiberianLithuanianLumbeeLuxembourgerMacedonianMalaysianMalteseMarshalleseMenomineeMexicanMexican American IndianMongolianMoroccanNative HawaiianNavajoNepaleseNew ZealanderNicaraguanNigerianNorthern EuropeanNorwegianOkinawanOsageOttawaPaiutePakistaniPalestinianPanamanianParaguayanPennsylvania GermanPeruvianPimaPolishPortuguesePotawatomiPuebloPuerto RicanPuget Sound SalishRomanianRussianSalvadoranSamoanScandinavianScotch-IrishScottishSeminoleSenegaleseSerbianShoshoneSierra LeoneanSiouxSlavicSlovakSloveneSomaliSouth AfricanSouth AmericanSouth American IndianSoviet UnionSpaniardSpanishSpanish AmericanSpanish American IndianSri LankanSubsaharan AfricanSudaneseSwedishSwissSyrianTaiwaneseThaiTlingit-HaidaTohono O'OdhamTonganTrinidadian and TobagonianTsimshianTurkishU.S. Virgin IslanderUgandanUkrainianUruguayanUteVenezuelanVietnameseWelshWest IndianYakamaYaquiYugoslavianYumanYup'ikZimbabwean
Immigration
NonimmigrantsImmigrantsAfghanistanAfricaAlbaniaArgentinaArmeniaAsiaAustraliaAustriaBahamasBangladeshBarbadosBelarusBelgiumBelizeBoliviaBosnia and HerzegovinaBrazilBulgariaBurma/MyanmarCabo VerdeCambodiaCameroonCanadaCaribbeanCentral AmericaChileChinaColombiaCongoCosta RicaCroatiaCubaCzechoslovakiaDenmarkDominicaDominican RepublicEastern AfricaEastern AsiaEastern EuropeEcuadorEgyptEl SalvadorEnglandEritreaEthiopiaEuropeFijiFranceGermanyGhanaGreeceGrenadaGuatemalaGuyanaHaitiHondurasHong KongHungaryIndiaIndonesiaIranIraqIrelandIsraelItalyJamaicaJapanJordanKazakhstanKenyaKoreaKuwaitLaosLatin AmericaLatviaLebanonLiberiaLithuaniaMalaysiaMexicoMicronesiaMiddle AfricaMoldovaMoroccoNepalNetherlandsNicaraguaNigeriaNorth AmericaNorth MacedoniaNorthern AfricaNorthern EuropeNorwayOceaniaPakistanPanamaPeruPhilippinesPolandPortugalRomaniaRussiaSaudi ArabiaScotlandSenegalSerbiaSierra LeoneSingaporeSomaliaSouth AfricaSouth AmericaSouth Central AsiaSouth Eastern AsiaSouthern EuropeSpainSri LankaSt. Vincent and the GrenadinesSudanSwitzerlandSyriaTaiwanThailandTrinidad and TobagoTurkeyUgandaUkraineUruguayUzbekistanVenezuelaVietnamWest IndiesWestern AfricaWestern AsiaWestern EuropeYemenZaireZimbabweAzores
Disability Age 35 to 64
Income
Poverty
Unemployment
Labor Participation
Family Structure
Vehicle Availability
Education Level
Disability

Disability Age 35 to 64 Comparison

Immigrants from Sweden

Aleuts

Exceptional
Tragic
9.9%
DISABILITY AGE 35 TO 64
99.7/ 100
METRIC RATING
59th/ 347
METRIC RANK
13.8%
DISABILITY AGE 35 TO 64
0.0/ 100
METRIC RATING
302nd/ 347
METRIC RANK

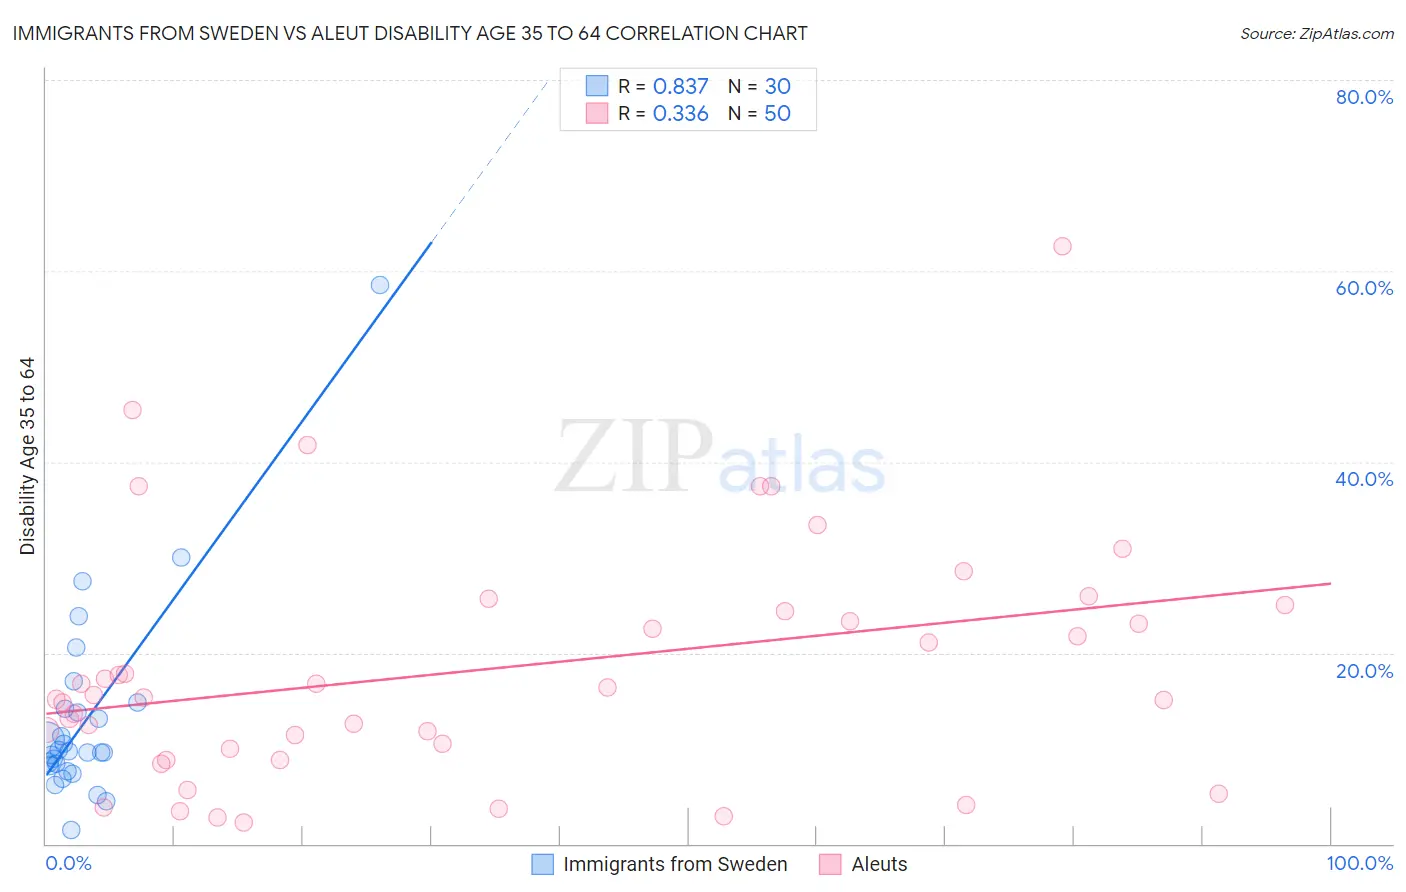
Immigrants from Sweden vs Aleut Disability Age 35 to 64 Correlation Chart

The statistical analysis conducted on geographies consisting of 164,695,763 people shows a very strong positive correlation between the proportion of Immigrants from Sweden and percentage of population with a disability between the ages 34 and 64 in the United States with a correlation coefficient (R) of 0.837 and weighted average of 9.9%. Similarly, the statistical analysis conducted on geographies consisting of 61,774,643 people shows a mild positive correlation between the proportion of Aleuts and percentage of population with a disability between the ages 34 and 64 in the United States with a correlation coefficient (R) of 0.336 and weighted average of 13.8%, a difference of 39.5%.
Immigrants from Sweden vs Aleut Disability Age 35 to 64

Disability Age 35 to 64 Correlation Summary

MeasurementImmigrants from SwedenAleut
Minimum1.4%2.2%
Maximum58.5%62.6%
Range57.1%60.4%
Mean13.2%18.3%
Median9.7%15.4%
Interquartile 25% (IQ1)8.2%9.9%
Interquartile 75% (IQ3)14.2%24.4%
Interquartile Range (IQR)6.0%14.5%
Standard Deviation (Sample)10.7%12.6%
Standard Deviation (Population)10.6%12.5%

Similar Demographics by Disability Age 35 to 64

Demographics Similar to Immigrants from Sweden by Disability Age 35 to 64

In terms of disability age 35 to 64, the demographic groups most similar to Immigrants from Sweden are Immigrants from South America (9.9%, a difference of 0.21%), Armenian (9.9%, a difference of 0.30%), Immigrants from Spain (10.0%, a difference of 0.33%), Colombian (9.9%, a difference of 0.40%), and South American (9.9%, a difference of 0.42%).
DemographicsRating | RankDisability Age 35 to 64
Immigrants | Bulgaria
99.8
/100
|
#52
Exceptional
9.8%
Taiwanese
99.8
/100
|
#53
Exceptional
9.8%
Immigrants | Russia
99.8
/100
|
#54
Exceptional
9.8%
Peruvians
99.8
/100
|
#55
Exceptional
9.9%
South Americans
99.8
/100
|
#56
Exceptional
9.9%
Colombians
99.8
/100
|
#57
Exceptional
9.9%
Armenians
99.8
/100
|
#58
Exceptional
9.9%
Immigrants | Sweden
99.7
/100
|
#59
Exceptional
9.9%
Immigrants | South America
99.7
/100
|
#60
Exceptional
9.9%
Immigrants | Spain
99.7
/100
|
#61
Exceptional
10.0%
Eastern Europeans
99.7
/100
|
#62
Exceptional
10.0%
Immigrants | Czechoslovakia
99.7
/100
|
#63
Exceptional
10.0%
Immigrants | Romania
99.7
/100
|
#64
Exceptional
10.0%
Immigrants | Poland
99.6
/100
|
#65
Exceptional
10.0%
Cubans
99.6
/100
|
#66
Exceptional
10.0%

Demographics Similar to Aleuts by Disability Age 35 to 64

In terms of disability age 35 to 64, the demographic groups most similar to Aleuts are Sioux (13.9%, a difference of 0.18%), Hopi (13.9%, a difference of 0.21%), American (13.9%, a difference of 0.59%), French American Indian (13.7%, a difference of 0.89%), and Delaware (13.7%, a difference of 1.2%).
DemographicsRating | RankDisability Age 35 to 64
Yakama
0.0
/100
|
#295
Tragic
13.6%
Africans
0.0
/100
|
#296
Tragic
13.6%
Bangladeshis
0.0
/100
|
#297
Tragic
13.6%
Cheyenne
0.0
/100
|
#298
Tragic
13.6%
Spanish Americans
0.0
/100
|
#299
Tragic
13.7%
Delaware
0.0
/100
|
#300
Tragic
13.7%
French American Indians
0.0
/100
|
#301
Tragic
13.7%
Aleuts
0.0
/100
|
#302
Tragic
13.8%
Sioux
0.0
/100
|
#303
Tragic
13.9%
Hopi
0.0
/100
|
#304
Tragic
13.9%
Americans
0.0
/100
|
#305
Tragic
13.9%
Immigrants | Yemen
0.0
/100
|
#306
Tragic
14.0%
Blackfeet
0.0
/100
|
#307
Tragic
14.1%
Inupiat
0.0
/100
|
#308
Tragic
14.1%
Cree
0.0
/100
|
#309
Tragic
14.1%