Immigrants from Sudan vs Immigrants from Chile Disability Age Over 75

COMPARE

Immigrants from Sudan
Race
Ancestry
AfghanAfricanAlaska NativeAlaskan AthabascanAlbanianAleutAlsatianAmericanApacheArabArapahoArgentineanArmenianAssyrian/Chaldean/SyriacAustralianAustrianBahamianBangladeshiBarbadianBasqueBelgianBelizeanBermudanBhutaneseBlackfeetBolivianBrazilianBritishBritish West IndianBulgarianBurmeseCajunCambodianCanadianCape VerdeanCarpatho RusynCelticCentral AmericanCentral American IndianCherokeeCheyenneChickasawChileanChineseChippewaChoctawColombianColvilleComancheCosta RicanCreeCreekCroatianCrowCubanCypriotCzechCzechoslovakianDanishDelawareDominicanDutchDutch West IndianEastern EuropeanEcuadorianEgyptianEnglishEstonianEthiopianEuropeanFijianFilipinoFinnishFrenchFrench American IndianFrench CanadianGermanGerman RussianGhanaianGreekGuamanian/ChamorroGuatemalanGuyaneseHaitianHmongHonduranHopiHoumaHungarianIcelanderIndian (Asian)IndonesianInupiatIranianIraqiIrishIroquoisIsraeliItalianJamaicanJapaneseJordanianKenyanKiowaKoreanLaotianLatvianLebaneseLiberianLithuanianLumbeeLuxembourgerMacedonianMalaysianMalteseMarshalleseMenomineeMexicanMexican American IndianMongolianMoroccanNative HawaiianNavajoNepaleseNew ZealanderNicaraguanNigerianNorthern EuropeanNorwegianOkinawanOsageOttawaPaiutePakistaniPalestinianPanamanianParaguayanPennsylvania GermanPeruvianPimaPolishPortuguesePotawatomiPuebloPuerto RicanPuget Sound SalishRomanianRussianSalvadoranSamoanScandinavianScotch-IrishScottishSeminoleSenegaleseSerbianShoshoneSierra LeoneanSiouxSlavicSlovakSloveneSomaliSouth AfricanSouth AmericanSouth American IndianSoviet UnionSpaniardSpanishSpanish AmericanSpanish American IndianSri LankanSubsaharan AfricanSudaneseSwedishSwissSyrianTaiwaneseThaiTlingit-HaidaTohono O'OdhamTonganTrinidadian and TobagonianTsimshianTurkishU.S. Virgin IslanderUgandanUkrainianUruguayanUteVenezuelanVietnameseWelshWest IndianYakamaYaquiYugoslavianYumanYup'ikZimbabwean
Immigration
NonimmigrantsImmigrantsAfghanistanAfricaAlbaniaArgentinaArmeniaAsiaAustraliaAustriaBahamasBangladeshBarbadosBelarusBelgiumBelizeBoliviaBosnia and HerzegovinaBrazilBulgariaBurma/MyanmarCabo VerdeCambodiaCameroonCanadaCaribbeanCentral AmericaChinaColombiaCongoCosta RicaCroatiaCubaCzechoslovakiaDenmarkDominicaDominican RepublicEastern AfricaEastern AsiaEastern EuropeEcuadorEgyptEl SalvadorEnglandEritreaEthiopiaEuropeFijiFranceGermanyGhanaGreeceGrenadaGuatemalaGuyanaHaitiHondurasHong KongHungaryIndiaIndonesiaIranIraqIrelandIsraelItalyJamaicaJapanJordanKazakhstanKenyaKoreaKuwaitLaosLatin AmericaLatviaLebanonLiberiaLithuaniaMalaysiaMexicoMicronesiaMiddle AfricaMoldovaMoroccoNepalNetherlandsNicaraguaNigeriaNorth AmericaNorth MacedoniaNorthern AfricaNorthern EuropeNorwayOceaniaPakistanPanamaPeruPhilippinesPolandPortugalRomaniaRussiaSaudi ArabiaScotlandSenegalSerbiaSierra LeoneSingaporeSomaliaSouth AfricaSouth AmericaSouth Central AsiaSouth Eastern AsiaSouthern EuropeSpainSri LankaSt. Vincent and the GrenadinesSudanSwedenSwitzerlandSyriaTaiwanThailandTrinidad and TobagoTurkeyUgandaUkraineUruguayUzbekistanVenezuelaVietnamWest IndiesWestern AfricaWestern AsiaWestern EuropeYemenZaireZimbabweAzores
Immigrants from Chile
Race
Ancestry
AfghanAfricanAlaska NativeAlaskan AthabascanAlbanianAleutAlsatianAmericanApacheArabArapahoArgentineanArmenianAssyrian/Chaldean/SyriacAustralianAustrianBahamianBangladeshiBarbadianBasqueBelgianBelizeanBermudanBhutaneseBlackfeetBolivianBrazilianBritishBritish West IndianBulgarianBurmeseCajunCambodianCanadianCape VerdeanCarpatho RusynCelticCentral AmericanCentral American IndianCherokeeCheyenneChickasawChileanChineseChippewaChoctawColombianColvilleComancheCosta RicanCreeCreekCroatianCrowCubanCypriotCzechCzechoslovakianDanishDelawareDominicanDutchDutch West IndianEastern EuropeanEcuadorianEgyptianEnglishEstonianEthiopianEuropeanFijianFilipinoFinnishFrenchFrench American IndianFrench CanadianGermanGerman RussianGhanaianGreekGuamanian/ChamorroGuatemalanGuyaneseHaitianHmongHonduranHopiHoumaHungarianIcelanderIndian (Asian)IndonesianInupiatIranianIraqiIrishIroquoisIsraeliItalianJamaicanJapaneseJordanianKenyanKiowaKoreanLaotianLatvianLebaneseLiberianLithuanianLumbeeLuxembourgerMacedonianMalaysianMalteseMarshalleseMenomineeMexicanMexican American IndianMongolianMoroccanNative HawaiianNavajoNepaleseNew ZealanderNicaraguanNigerianNorthern EuropeanNorwegianOkinawanOsageOttawaPaiutePakistaniPalestinianPanamanianParaguayanPennsylvania GermanPeruvianPimaPolishPortuguesePotawatomiPuebloPuerto RicanPuget Sound SalishRomanianRussianSalvadoranSamoanScandinavianScotch-IrishScottishSeminoleSenegaleseSerbianShoshoneSierra LeoneanSiouxSlavicSlovakSloveneSomaliSouth AfricanSouth AmericanSouth American IndianSoviet UnionSpaniardSpanishSpanish AmericanSpanish American IndianSri LankanSubsaharan AfricanSudaneseSwedishSwissSyrianTaiwaneseThaiTlingit-HaidaTohono O'OdhamTonganTrinidadian and TobagonianTsimshianTurkishU.S. Virgin IslanderUgandanUkrainianUruguayanUteVenezuelanVietnameseWelshWest IndianYakamaYaquiYugoslavianYumanYup'ikZimbabwean
Immigration
NonimmigrantsImmigrantsAfghanistanAfricaAlbaniaArgentinaArmeniaAsiaAustraliaAustriaBahamasBangladeshBarbadosBelarusBelgiumBelizeBoliviaBosnia and HerzegovinaBrazilBulgariaBurma/MyanmarCabo VerdeCambodiaCameroonCanadaCaribbeanCentral AmericaChileChinaColombiaCongoCosta RicaCroatiaCubaCzechoslovakiaDenmarkDominicaDominican RepublicEastern AfricaEastern AsiaEastern EuropeEcuadorEgyptEl SalvadorEnglandEritreaEthiopiaEuropeFijiFranceGermanyGhanaGreeceGrenadaGuatemalaGuyanaHaitiHondurasHong KongHungaryIndiaIndonesiaIranIraqIrelandIsraelItalyJamaicaJapanJordanKazakhstanKenyaKoreaKuwaitLaosLatin AmericaLatviaLebanonLiberiaLithuaniaMalaysiaMexicoMicronesiaMiddle AfricaMoldovaMoroccoNepalNetherlandsNicaraguaNigeriaNorth AmericaNorth MacedoniaNorthern AfricaNorthern EuropeNorwayOceaniaPakistanPanamaPeruPhilippinesPolandPortugalRomaniaRussiaSaudi ArabiaScotlandSenegalSerbiaSierra LeoneSingaporeSomaliaSouth AfricaSouth AmericaSouth Central AsiaSouth Eastern AsiaSouthern EuropeSpainSri LankaSt. Vincent and the GrenadinesSwedenSwitzerlandSyriaTaiwanThailandTrinidad and TobagoTurkeyUgandaUkraineUruguayUzbekistanVenezuelaVietnamWest IndiesWestern AfricaWestern AsiaWestern EuropeYemenZaireZimbabweAzores
Disability Age Over 75
Income
Poverty
Unemployment
Labor Participation
Family Structure
Vehicle Availability
Education Level
Disability

Disability Age Over 75 Comparison

Immigrants from Sudan

Immigrants from Chile

Fair
Exceptional
47.5%
DISABILITY AGE OVER 75
31.8/ 100
METRIC RATING
187th/ 347
METRIC RANK
46.5%
DISABILITY AGE OVER 75
96.4/ 100
METRIC RATING
111th/ 347
METRIC RANK

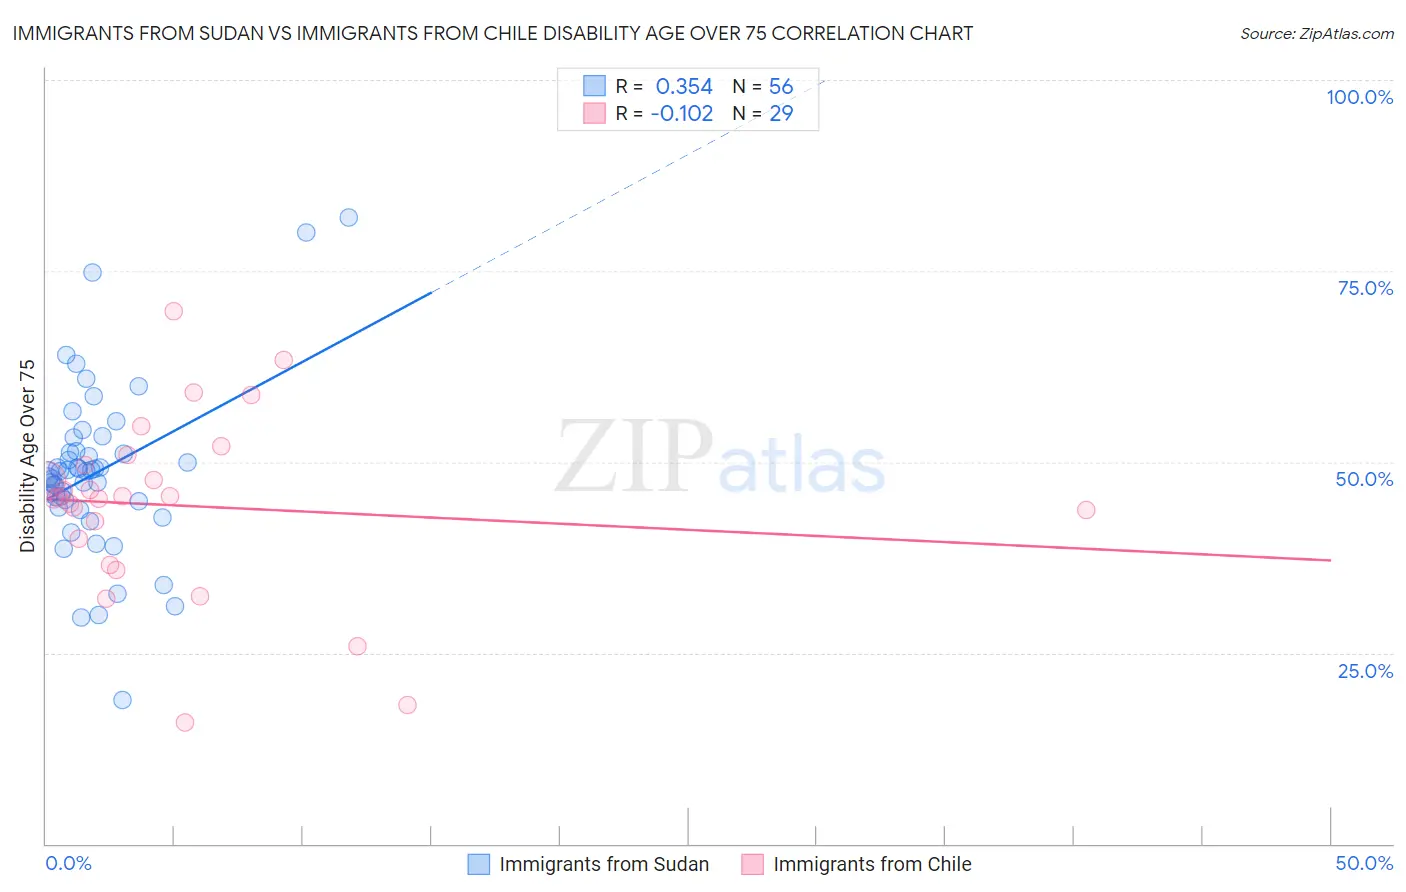
Immigrants from Sudan vs Immigrants from Chile Disability Age Over 75 Correlation Chart

The statistical analysis conducted on geographies consisting of 118,950,440 people shows a mild positive correlation between the proportion of Immigrants from Sudan and percentage of population with a disability over the age of 75 in the United States with a correlation coefficient (R) of 0.354 and weighted average of 47.5%. Similarly, the statistical analysis conducted on geographies consisting of 218,556,644 people shows a poor negative correlation between the proportion of Immigrants from Chile and percentage of population with a disability over the age of 75 in the United States with a correlation coefficient (R) of -0.102 and weighted average of 46.5%, a difference of 2.3%.
Immigrants from Sudan vs Immigrants from Chile Disability Age Over 75

Disability Age Over 75 Correlation Summary

MeasurementImmigrants from SudanImmigrants from Chile
Minimum18.9%15.8%
Maximum82.1%69.8%
Range63.2%54.0%
Mean48.6%44.3%
Median48.6%45.3%
Interquartile 25% (IQ1)44.4%38.3%
Interquartile 75% (IQ3)51.3%50.2%
Interquartile Range (IQR)6.8%12.0%
Standard Deviation (Sample)11.1%11.9%
Standard Deviation (Population)11.0%11.7%

Similar Demographics by Disability Age Over 75

Demographics Similar to Immigrants from Sudan by Disability Age Over 75

In terms of disability age over 75, the demographic groups most similar to Immigrants from Sudan are Sudanese (47.5%, a difference of 0.010%), Basque (47.6%, a difference of 0.020%), Immigrants from Kenya (47.6%, a difference of 0.020%), Ghanaian (47.5%, a difference of 0.030%), and Immigrants from Nigeria (47.5%, a difference of 0.060%).
DemographicsRating | RankDisability Age Over 75
Immigrants | Ecuador
41.7
/100
|
#180
Average
47.4%
Immigrants | Kazakhstan
40.4
/100
|
#181
Average
47.4%
Immigrants | Moldova
39.9
/100
|
#182
Fair
47.4%
Delaware
39.1
/100
|
#183
Fair
47.5%
Immigrants | Nigeria
34.0
/100
|
#184
Fair
47.5%
Ghanaians
33.0
/100
|
#185
Fair
47.5%
Sudanese
32.0
/100
|
#186
Fair
47.5%
Immigrants | Sudan
31.8
/100
|
#187
Fair
47.5%
Basques
30.9
/100
|
#188
Fair
47.6%
Immigrants | Kenya
30.8
/100
|
#189
Fair
47.6%
Somalis
29.5
/100
|
#190
Fair
47.6%
Portuguese
29.3
/100
|
#191
Fair
47.6%
Immigrants | Jamaica
28.3
/100
|
#192
Fair
47.6%
Ottawa
28.1
/100
|
#193
Fair
47.6%
Immigrants | Lebanon
26.5
/100
|
#194
Fair
47.6%

Demographics Similar to Immigrants from Chile by Disability Age Over 75

In terms of disability age over 75, the demographic groups most similar to Immigrants from Chile are Immigrants from Hong Kong (46.5%, a difference of 0.0%), Chilean (46.5%, a difference of 0.010%), Brazilian (46.5%, a difference of 0.040%), Immigrants from Pakistan (46.5%, a difference of 0.040%), and Immigrants from Uruguay (46.4%, a difference of 0.050%).
DemographicsRating | RankDisability Age Over 75
Israelis
97.0
/100
|
#104
Exceptional
46.4%
Immigrants | Cameroon
96.9
/100
|
#105
Exceptional
46.4%
Immigrants | Kuwait
96.8
/100
|
#106
Exceptional
46.4%
Immigrants | Uruguay
96.7
/100
|
#107
Exceptional
46.4%
Brazilians
96.6
/100
|
#108
Exceptional
46.5%
Chileans
96.4
/100
|
#109
Exceptional
46.5%
Immigrants | Hong Kong
96.4
/100
|
#110
Exceptional
46.5%
Immigrants | Chile
96.4
/100
|
#111
Exceptional
46.5%
Immigrants | Pakistan
96.1
/100
|
#112
Exceptional
46.5%
Irish
96.0
/100
|
#113
Exceptional
46.5%
Dutch
95.9
/100
|
#114
Exceptional
46.5%
British
95.7
/100
|
#115
Exceptional
46.5%
Indians (Asian)
95.7
/100
|
#116
Exceptional
46.5%
Hungarians
95.3
/100
|
#117
Exceptional
46.5%
Czechoslovakians
94.7
/100
|
#118
Exceptional
46.6%