Immigrants from South Eastern Asia vs Ghanaian Male Disability

COMPARE

Immigrants from South Eastern Asia
Race
Ancestry
AfghanAfricanAlaska NativeAlaskan AthabascanAlbanianAleutAlsatianAmericanApacheArabArapahoArgentineanArmenianAssyrian/Chaldean/SyriacAustralianAustrianBahamianBangladeshiBarbadianBasqueBelgianBelizeanBermudanBhutaneseBlackfeetBolivianBrazilianBritishBritish West IndianBulgarianBurmeseCajunCambodianCanadianCape VerdeanCarpatho RusynCelticCentral AmericanCentral American IndianCherokeeCheyenneChickasawChileanChineseChippewaChoctawColombianColvilleComancheCosta RicanCreeCreekCroatianCrowCubanCypriotCzechCzechoslovakianDanishDelawareDominicanDutchDutch West IndianEastern EuropeanEcuadorianEgyptianEnglishEstonianEthiopianEuropeanFijianFilipinoFinnishFrenchFrench American IndianFrench CanadianGermanGerman RussianGreekGuamanian/ChamorroGuatemalanGuyaneseHaitianHmongHonduranHopiHoumaHungarianIcelanderIndian (Asian)IndonesianInupiatIranianIraqiIrishIroquoisIsraeliItalianJamaicanJapaneseJordanianKenyanKiowaKoreanLaotianLatvianLebaneseLiberianLithuanianLumbeeLuxembourgerMacedonianMalaysianMalteseMarshalleseMenomineeMexicanMexican American IndianMongolianMoroccanNative HawaiianNavajoNepaleseNew ZealanderNicaraguanNigerianNorthern EuropeanNorwegianOkinawanOsageOttawaPaiutePakistaniPalestinianPanamanianParaguayanPennsylvania GermanPeruvianPimaPolishPortuguesePotawatomiPuebloPuerto RicanPuget Sound SalishRomanianRussianSalvadoranSamoanScandinavianScotch-IrishScottishSeminoleSenegaleseSerbianShoshoneSierra LeoneanSiouxSlavicSlovakSloveneSomaliSouth AfricanSouth AmericanSouth American IndianSoviet UnionSpaniardSpanishSpanish AmericanSpanish American IndianSri LankanSubsaharan AfricanSudaneseSwedishSwissSyrianTaiwaneseThaiTlingit-HaidaTohono O'OdhamTonganTrinidadian and TobagonianTsimshianTurkishU.S. Virgin IslanderUgandanUkrainianUruguayanUteVenezuelanVietnameseWelshWest IndianYakamaYaquiYugoslavianYumanYup'ikZimbabwean
Immigration
NonimmigrantsImmigrantsAfghanistanAfricaAlbaniaArgentinaArmeniaAsiaAustraliaAustriaBahamasBangladeshBarbadosBelarusBelgiumBelizeBoliviaBosnia and HerzegovinaBrazilBulgariaBurma/MyanmarCabo VerdeCambodiaCameroonCanadaCaribbeanCentral AmericaChileChinaColombiaCongoCosta RicaCroatiaCubaCzechoslovakiaDenmarkDominicaDominican RepublicEastern AfricaEastern AsiaEastern EuropeEcuadorEgyptEl SalvadorEnglandEritreaEthiopiaEuropeFijiFranceGermanyGhanaGreeceGrenadaGuatemalaGuyanaHaitiHondurasHong KongHungaryIndiaIndonesiaIranIraqIrelandIsraelItalyJamaicaJapanJordanKazakhstanKenyaKoreaKuwaitLaosLatin AmericaLatviaLebanonLiberiaLithuaniaMalaysiaMexicoMicronesiaMiddle AfricaMoldovaMoroccoNepalNetherlandsNicaraguaNigeriaNorth AmericaNorth MacedoniaNorthern AfricaNorthern EuropeNorwayOceaniaPakistanPanamaPeruPhilippinesPolandPortugalRomaniaRussiaSaudi ArabiaScotlandSenegalSerbiaSierra LeoneSingaporeSomaliaSouth AfricaSouth AmericaSouth Central AsiaSouth Eastern AsiaSouthern EuropeSpainSri LankaSt. Vincent and the GrenadinesSudanSwedenSwitzerlandSyriaTaiwanThailandTrinidad and TobagoTurkeyUgandaUkraineUruguayUzbekistanVenezuelaVietnamWest IndiesWestern AfricaWestern AsiaWestern EuropeYemenZaireZimbabweAzores
Ghanaian
Race
Ancestry
AfghanAfricanAlaska NativeAlaskan AthabascanAlbanianAleutAlsatianAmericanApacheArabArapahoArgentineanArmenianAssyrian/Chaldean/SyriacAustralianAustrianBahamianBangladeshiBarbadianBasqueBelgianBelizeanBermudanBhutaneseBlackfeetBolivianBrazilianBritishBritish West IndianBulgarianBurmeseCajunCambodianCanadianCape VerdeanCarpatho RusynCelticCentral AmericanCentral American IndianCherokeeCheyenneChickasawChileanChineseChippewaChoctawColombianColvilleComancheCosta RicanCreeCreekCroatianCrowCubanCypriotCzechCzechoslovakianDanishDelawareDominicanDutchDutch West IndianEastern EuropeanEcuadorianEgyptianEnglishEstonianEthiopianEuropeanFijianFilipinoFinnishFrenchFrench American IndianFrench CanadianGermanGerman RussianGhanaianGreekGuamanian/ChamorroGuatemalanGuyaneseHaitianHmongHonduranHopiHoumaHungarianIcelanderIndian (Asian)IndonesianInupiatIranianIraqiIrishIroquoisIsraeliItalianJamaicanJapaneseJordanianKenyanKiowaKoreanLaotianLatvianLebaneseLiberianLithuanianLumbeeLuxembourgerMacedonianMalaysianMalteseMarshalleseMenomineeMexicanMexican American IndianMongolianMoroccanNative HawaiianNavajoNepaleseNew ZealanderNicaraguanNigerianNorthern EuropeanNorwegianOkinawanOsageOttawaPaiutePakistaniPalestinianPanamanianParaguayanPennsylvania GermanPeruvianPimaPolishPortuguesePotawatomiPuebloPuerto RicanPuget Sound SalishRomanianRussianSalvadoranSamoanScandinavianScotch-IrishScottishSeminoleSenegaleseSerbianShoshoneSierra LeoneanSiouxSlavicSlovakSloveneSomaliSouth AfricanSouth AmericanSouth American IndianSoviet UnionSpaniardSpanishSpanish AmericanSpanish American IndianSri LankanSubsaharan AfricanSudaneseSwedishSwissSyrianTaiwaneseThaiTlingit-HaidaTohono O'OdhamTonganTrinidadian and TobagonianTsimshianTurkishU.S. Virgin IslanderUgandanUkrainianUruguayanUteVenezuelanVietnameseWelshWest IndianYakamaYaquiYugoslavianYumanYup'ikZimbabwean
Immigration
NonimmigrantsImmigrantsAfghanistanAfricaAlbaniaArgentinaArmeniaAsiaAustraliaAustriaBahamasBangladeshBarbadosBelarusBelgiumBelizeBoliviaBosnia and HerzegovinaBrazilBulgariaBurma/MyanmarCabo VerdeCambodiaCameroonCanadaCaribbeanCentral AmericaChileChinaColombiaCongoCosta RicaCroatiaCubaCzechoslovakiaDenmarkDominicaDominican RepublicEastern AfricaEastern AsiaEastern EuropeEcuadorEgyptEl SalvadorEnglandEritreaEthiopiaEuropeFijiFranceGermanyGhanaGreeceGrenadaGuatemalaGuyanaHaitiHondurasHong KongHungaryIndiaIndonesiaIranIraqIrelandIsraelItalyJamaicaJapanJordanKazakhstanKenyaKoreaKuwaitLaosLatin AmericaLatviaLebanonLiberiaLithuaniaMalaysiaMexicoMicronesiaMiddle AfricaMoldovaMoroccoNepalNetherlandsNicaraguaNigeriaNorth AmericaNorth MacedoniaNorthern AfricaNorthern EuropeNorwayOceaniaPakistanPanamaPeruPhilippinesPolandPortugalRomaniaRussiaSaudi ArabiaScotlandSenegalSerbiaSierra LeoneSingaporeSomaliaSouth AfricaSouth AmericaSouth Central AsiaSouthern EuropeSpainSri LankaSt. Vincent and the GrenadinesSudanSwedenSwitzerlandSyriaTaiwanThailandTrinidad and TobagoTurkeyUgandaUkraineUruguayUzbekistanVenezuelaVietnamWest IndiesWestern AfricaWestern AsiaWestern EuropeYemenZaireZimbabweAzores
Male Disability
Income
Poverty
Unemployment
Labor Participation
Family Structure
Vehicle Availability
Education Level
Disability

Male Disability Comparison

Immigrants from South Eastern Asia

Ghanaians

Excellent
Exceptional
10.9%
MALE DISABILITY
89.2/ 100
METRIC RATING
121st/ 347
METRIC RANK
10.8%
MALE DISABILITY
93.4/ 100
METRIC RATING
112th/ 347
METRIC RANK

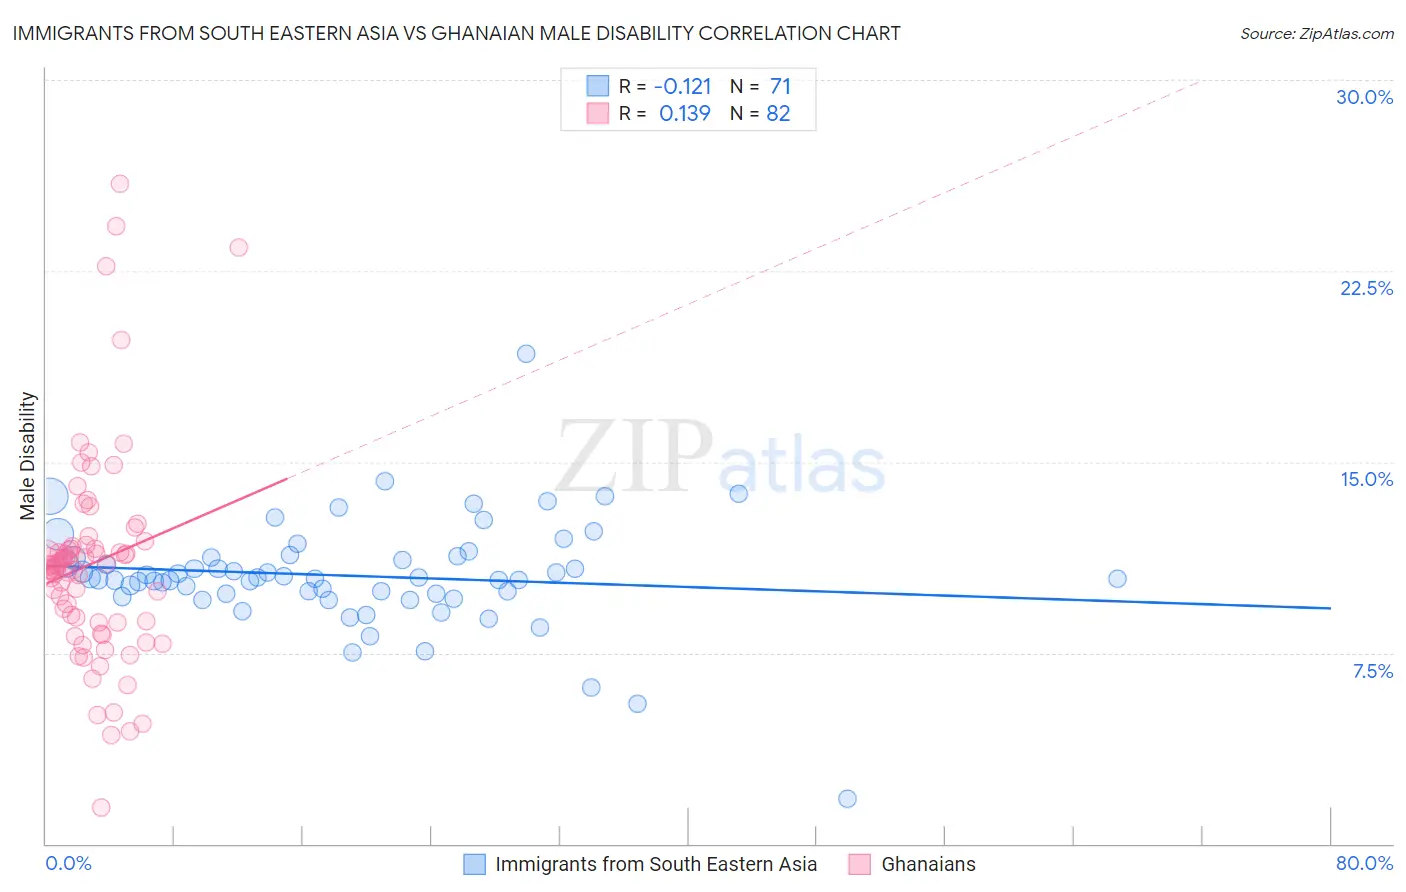
Immigrants from South Eastern Asia vs Ghanaian Male Disability Correlation Chart

The statistical analysis conducted on geographies consisting of 512,522,029 people shows a poor negative correlation between the proportion of Immigrants from South Eastern Asia and percentage of males with a disability in the United States with a correlation coefficient (R) of -0.121 and weighted average of 10.9%. Similarly, the statistical analysis conducted on geographies consisting of 190,687,278 people shows a poor positive correlation between the proportion of Ghanaians and percentage of males with a disability in the United States with a correlation coefficient (R) of 0.139 and weighted average of 10.8%, a difference of 0.77%.
Immigrants from South Eastern Asia vs Ghanaian Male Disability

Male Disability Correlation Summary

MeasurementImmigrants from South Eastern AsiaGhanaian
Minimum1.8%1.4%
Maximum19.3%25.9%
Range17.5%24.5%
Mean10.5%11.0%
Median10.4%11.0%
Interquartile 25% (IQ1)9.8%8.7%
Interquartile 75% (IQ3)11.2%11.7%
Interquartile Range (IQR)1.4%3.0%
Standard Deviation (Sample)2.2%4.2%
Standard Deviation (Population)2.2%4.1%

Demographics Similar to Immigrants from South Eastern Asia and Ghanaians by Male Disability

In terms of male disability, the demographic groups most similar to Immigrants from South Eastern Asia are Immigrants from Ghana (10.9%, a difference of 0.010%), Immigrants from Africa (10.9%, a difference of 0.040%), Immigrants from Czechoslovakia (10.9%, a difference of 0.11%), Immigrants from Cuba (10.9%, a difference of 0.15%), and Armenian (10.9%, a difference of 0.15%). Similarly, the demographic groups most similar to Ghanaians are Immigrants from Zimbabwe (10.8%, a difference of 0.090%), Immigrants from Uruguay (10.8%, a difference of 0.10%), Immigrants (10.8%, a difference of 0.14%), Central American (10.8%, a difference of 0.15%), and Immigrants from Uganda (10.8%, a difference of 0.16%).
DemographicsRating | RankMale Disability
Immigrants | Syria
94.9
/100
|
#106
Exceptional
10.8%
Immigrants | Eastern Africa
94.3
/100
|
#107
Exceptional
10.8%
Immigrants | Belgium
94.2
/100
|
#108
Exceptional
10.8%
Immigrants | Uganda
94.0
/100
|
#109
Exceptional
10.8%
Immigrants | Immigrants
93.9
/100
|
#110
Exceptional
10.8%
Immigrants | Uruguay
93.8
/100
|
#111
Exceptional
10.8%
Ghanaians
93.4
/100
|
#112
Exceptional
10.8%
Immigrants | Zimbabwe
93.0
/100
|
#113
Exceptional
10.8%
Central Americans
92.7
/100
|
#114
Exceptional
10.8%
Immigrants | Barbados
92.2
/100
|
#115
Exceptional
10.8%
Immigrants | South Africa
91.8
/100
|
#116
Exceptional
10.8%
Eastern Europeans
90.6
/100
|
#117
Exceptional
10.9%
Immigrants | Cuba
90.2
/100
|
#118
Exceptional
10.9%
Armenians
90.1
/100
|
#119
Exceptional
10.9%
Immigrants | Africa
89.4
/100
|
#120
Excellent
10.9%
Immigrants | South Eastern Asia
89.2
/100
|
#121
Excellent
10.9%
Immigrants | Ghana
89.0
/100
|
#122
Excellent
10.9%
Immigrants | Czechoslovakia
88.4
/100
|
#123
Excellent
10.9%
South American Indians
88.1
/100
|
#124
Excellent
10.9%
Immigrants | North Macedonia
88.1
/100
|
#125
Excellent
10.9%
Immigrants | Trinidad and Tobago
86.9
/100
|
#126
Excellent
10.9%