Immigrants from South Central Asia vs Immigrants from Northern Europe Ambulatory Disability
COMPARE
Immigrants from South Central Asia
Immigrants from Northern Europe
Ambulatory Disability
Ambulatory Disability Comparison
Immigrants from South Central Asia
Immigrants from Northern Europe
5.1%
AMBULATORY DISABILITY
100.0/ 100
METRIC RATING
8th/ 347
METRIC RANK
5.8%
AMBULATORY DISABILITY
98.2/ 100
METRIC RATING
99th/ 347
METRIC RANK
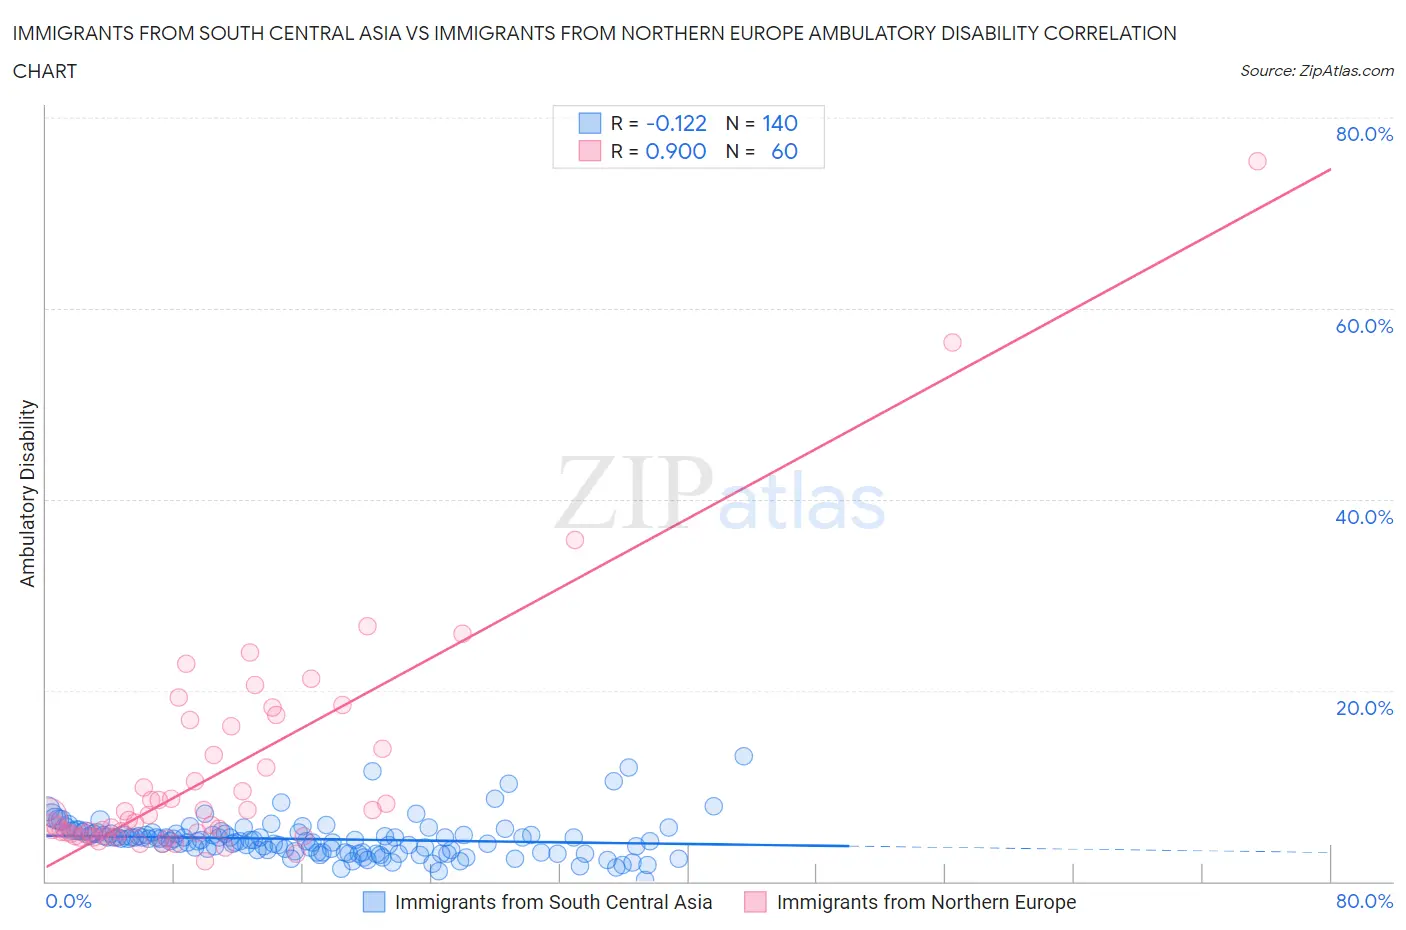
Immigrants from South Central Asia vs Immigrants from Northern Europe Ambulatory Disability Correlation Chart
The statistical analysis conducted on geographies consisting of 472,870,749 people shows a poor negative correlation between the proportion of Immigrants from South Central Asia and percentage of population with ambulatory disability in the United States with a correlation coefficient (R) of -0.122 and weighted average of 5.1%. Similarly, the statistical analysis conducted on geographies consisting of 477,075,376 people shows a very strong positive correlation between the proportion of Immigrants from Northern Europe and percentage of population with ambulatory disability in the United States with a correlation coefficient (R) of 0.900 and weighted average of 5.8%, a difference of 13.4%.
Ambulatory Disability Correlation Summary
| Measurement | Immigrants from South Central Asia | Immigrants from Northern Europe |
| Minimum | 0.18% | 2.1% |
| Maximum | 13.0% | 75.4% |
| Range | 12.9% | 73.3% |
| Mean | 4.4% | 11.7% |
| Median | 4.4% | 6.9% |
| Interquartile 25% (IQ1) | 3.0% | 5.0% |
| Interquartile 75% (IQ3) | 5.0% | 15.1% |
| Interquartile Range (IQR) | 2.0% | 10.1% |
| Standard Deviation (Sample) | 2.0% | 12.6% |
| Standard Deviation (Population) | 2.0% | 12.5% |
Similar Demographics by Ambulatory Disability
Demographics Similar to Immigrants from South Central Asia by Ambulatory Disability
In terms of ambulatory disability, the demographic groups most similar to Immigrants from South Central Asia are Iranian (5.1%, a difference of 0.36%), Yup'ik (5.2%, a difference of 0.97%), Bolivian (5.1%, a difference of 0.99%), Immigrants from Bolivia (5.0%, a difference of 1.4%), and Immigrants from Singapore (5.0%, a difference of 2.1%).
| Demographics | Rating | Rank | Ambulatory Disability |
| Immigrants | India | 100.0 /100 | #1 | Exceptional 4.8% |
| Filipinos | 100.0 /100 | #2 | Exceptional 4.9% |
| Thais | 100.0 /100 | #3 | Exceptional 4.9% |
| Immigrants | Taiwan | 100.0 /100 | #4 | Exceptional 4.9% |
| Immigrants | Singapore | 100.0 /100 | #5 | Exceptional 5.0% |
| Immigrants | Bolivia | 100.0 /100 | #6 | Exceptional 5.0% |
| Bolivians | 100.0 /100 | #7 | Exceptional 5.1% |
| Immigrants | South Central Asia | 100.0 /100 | #8 | Exceptional 5.1% |
| Iranians | 100.0 /100 | #9 | Exceptional 5.1% |
| Yup'ik | 100.0 /100 | #10 | Exceptional 5.2% |
| Immigrants | Korea | 100.0 /100 | #11 | Exceptional 5.2% |
| Okinawans | 100.0 /100 | #12 | Exceptional 5.3% |
| Burmese | 100.0 /100 | #13 | Exceptional 5.3% |
| Immigrants | Eastern Asia | 100.0 /100 | #14 | Exceptional 5.3% |
| Immigrants | China | 100.0 /100 | #15 | Exceptional 5.3% |
Demographics Similar to Immigrants from Northern Europe by Ambulatory Disability
In terms of ambulatory disability, the demographic groups most similar to Immigrants from Northern Europe are Immigrants from Lebanon (5.8%, a difference of 0.090%), Immigrants from Somalia (5.8%, a difference of 0.11%), Salvadoran (5.8%, a difference of 0.15%), Immigrants from El Salvador (5.8%, a difference of 0.17%), and Immigrants from Serbia (5.8%, a difference of 0.19%).
| Demographics | Rating | Rank | Ambulatory Disability |
| Immigrants | Sierra Leone | 98.6 /100 | #92 | Exceptional 5.8% |
| Immigrants | Denmark | 98.6 /100 | #93 | Exceptional 5.8% |
| Kenyans | 98.4 /100 | #94 | Exceptional 5.8% |
| Immigrants | El Salvador | 98.4 /100 | #95 | Exceptional 5.8% |
| Salvadorans | 98.4 /100 | #96 | Exceptional 5.8% |
| Immigrants | Somalia | 98.3 /100 | #97 | Exceptional 5.8% |
| Immigrants | Lebanon | 98.3 /100 | #98 | Exceptional 5.8% |
| Immigrants | Northern Europe | 98.2 /100 | #99 | Exceptional 5.8% |
| Immigrants | Serbia | 97.9 /100 | #100 | Exceptional 5.8% |
| Immigrants | South America | 97.9 /100 | #101 | Exceptional 5.8% |
| Immigrants | Kenya | 97.8 /100 | #102 | Exceptional 5.8% |
| Immigrants | Romania | 97.7 /100 | #103 | Exceptional 5.8% |
| New Zealanders | 97.6 /100 | #104 | Exceptional 5.8% |
| Immigrants | Czechoslovakia | 97.4 /100 | #105 | Exceptional 5.8% |
| Immigrants | Morocco | 97.3 /100 | #106 | Exceptional 5.8% |