Immigrants from Singapore vs Moroccan Cognitive Disability
COMPARE
Immigrants from Singapore
Moroccan
Cognitive Disability
Cognitive Disability Comparison
Immigrants from Singapore
Moroccans
17.5%
COGNITIVE DISABILITY
14.3/ 100
METRIC RATING
199th/ 347
METRIC RANK
17.6%
COGNITIVE DISABILITY
5.9/ 100
METRIC RATING
221st/ 347
METRIC RANK
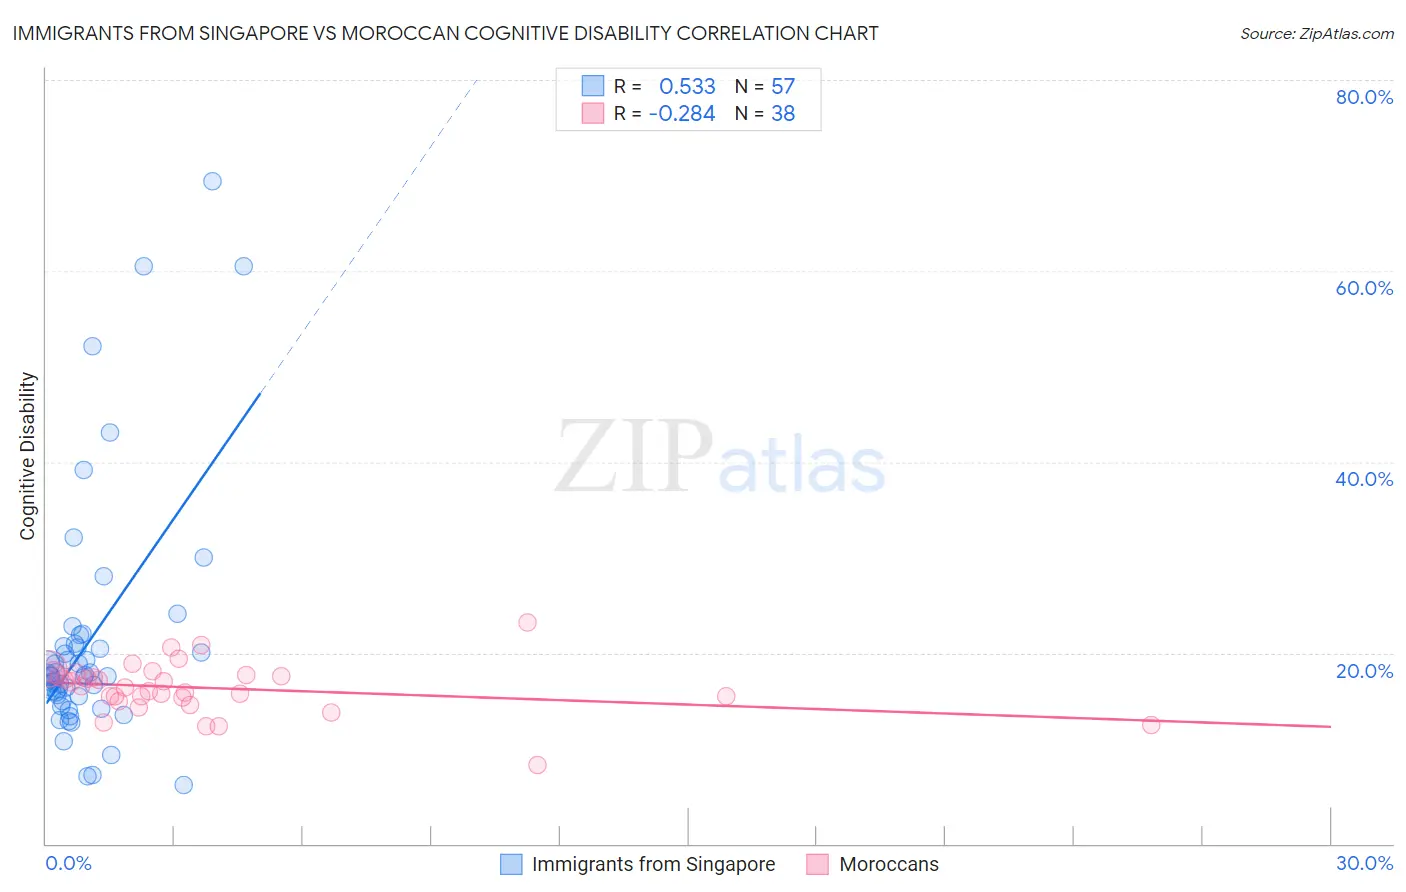
Immigrants from Singapore vs Moroccan Cognitive Disability Correlation Chart
The statistical analysis conducted on geographies consisting of 137,519,920 people shows a substantial positive correlation between the proportion of Immigrants from Singapore and percentage of population with cognitive disability in the United States with a correlation coefficient (R) of 0.533 and weighted average of 17.5%. Similarly, the statistical analysis conducted on geographies consisting of 201,805,523 people shows a weak negative correlation between the proportion of Moroccans and percentage of population with cognitive disability in the United States with a correlation coefficient (R) of -0.284 and weighted average of 17.6%, a difference of 0.68%.
Cognitive Disability Correlation Summary
| Measurement | Immigrants from Singapore | Moroccan |
| Minimum | 6.1% | 8.3% |
| Maximum | 69.3% | 23.2% |
| Range | 63.2% | 15.0% |
| Mean | 21.2% | 16.3% |
| Median | 17.6% | 16.4% |
| Interquartile 25% (IQ1) | 15.2% | 15.4% |
| Interquartile 75% (IQ3) | 20.8% | 17.7% |
| Interquartile Range (IQR) | 5.6% | 2.3% |
| Standard Deviation (Sample) | 12.8% | 2.7% |
| Standard Deviation (Population) | 12.7% | 2.7% |
Similar Demographics by Cognitive Disability
Demographics Similar to Immigrants from Singapore by Cognitive Disability
In terms of cognitive disability, the demographic groups most similar to Immigrants from Singapore are Haitian (17.5%, a difference of 0.010%), Immigrants from Panama (17.5%, a difference of 0.030%), South American Indian (17.5%, a difference of 0.080%), Immigrants from Afghanistan (17.5%, a difference of 0.13%), and Immigrants from Morocco (17.5%, a difference of 0.14%).
| Demographics | Rating | Rank | Cognitive Disability |
| Immigrants | Haiti | 27.1 /100 | #192 | Fair 17.4% |
| Delaware | 25.6 /100 | #193 | Fair 17.4% |
| Immigrants | Bosnia and Herzegovina | 22.0 /100 | #194 | Fair 17.4% |
| New Zealanders | 21.1 /100 | #195 | Fair 17.4% |
| Guyanese | 17.5 /100 | #196 | Poor 17.5% |
| Immigrants | Afghanistan | 16.7 /100 | #197 | Poor 17.5% |
| Immigrants | Panama | 14.8 /100 | #198 | Poor 17.5% |
| Immigrants | Singapore | 14.3 /100 | #199 | Poor 17.5% |
| Haitians | 14.1 /100 | #200 | Poor 17.5% |
| South American Indians | 13.0 /100 | #201 | Poor 17.5% |
| Immigrants | Morocco | 12.0 /100 | #202 | Poor 17.5% |
| Immigrants | Caribbean | 11.0 /100 | #203 | Poor 17.5% |
| Immigrants | Zimbabwe | 11.0 /100 | #204 | Poor 17.5% |
| Puget Sound Salish | 10.9 /100 | #205 | Poor 17.5% |
| Alaska Natives | 10.4 /100 | #206 | Poor 17.5% |
Demographics Similar to Moroccans by Cognitive Disability
In terms of cognitive disability, the demographic groups most similar to Moroccans are Zimbabwean (17.6%, a difference of 0.020%), Icelander (17.6%, a difference of 0.050%), Immigrants from Sierra Leone (17.6%, a difference of 0.050%), Salvadoran (17.6%, a difference of 0.090%), and Okinawan (17.6%, a difference of 0.10%).
| Demographics | Rating | Rank | Cognitive Disability |
| Immigrants | El Salvador | 7.0 /100 | #214 | Tragic 17.6% |
| Alaskan Athabascans | 6.9 /100 | #215 | Tragic 17.6% |
| Okinawans | 6.8 /100 | #216 | Tragic 17.6% |
| Salvadorans | 6.7 /100 | #217 | Tragic 17.6% |
| Icelanders | 6.4 /100 | #218 | Tragic 17.6% |
| Immigrants | Sierra Leone | 6.3 /100 | #219 | Tragic 17.6% |
| Zimbabweans | 6.1 /100 | #220 | Tragic 17.6% |
| Moroccans | 5.9 /100 | #221 | Tragic 17.6% |
| Central Americans | 4.5 /100 | #222 | Tragic 17.7% |
| Alsatians | 4.5 /100 | #223 | Tragic 17.7% |
| Fijians | 3.4 /100 | #224 | Tragic 17.7% |
| Vietnamese | 3.4 /100 | #225 | Tragic 17.7% |
| Marshallese | 2.7 /100 | #226 | Tragic 17.7% |
| Immigrants | St. Vincent and the Grenadines | 2.6 /100 | #227 | Tragic 17.7% |
| Immigrants | Central America | 2.3 /100 | #228 | Tragic 17.7% |