Immigrants from Singapore vs Ghanaian Hearing Disability
COMPARE
Immigrants from Singapore
Ghanaian
Hearing Disability
Hearing Disability Comparison
Immigrants from Singapore
Ghanaians
2.6%
HEARING DISABILITY
99.3/ 100
METRIC RATING
48th/ 347
METRIC RANK
2.5%
HEARING DISABILITY
99.8/ 100
METRIC RATING
21st/ 347
METRIC RANK
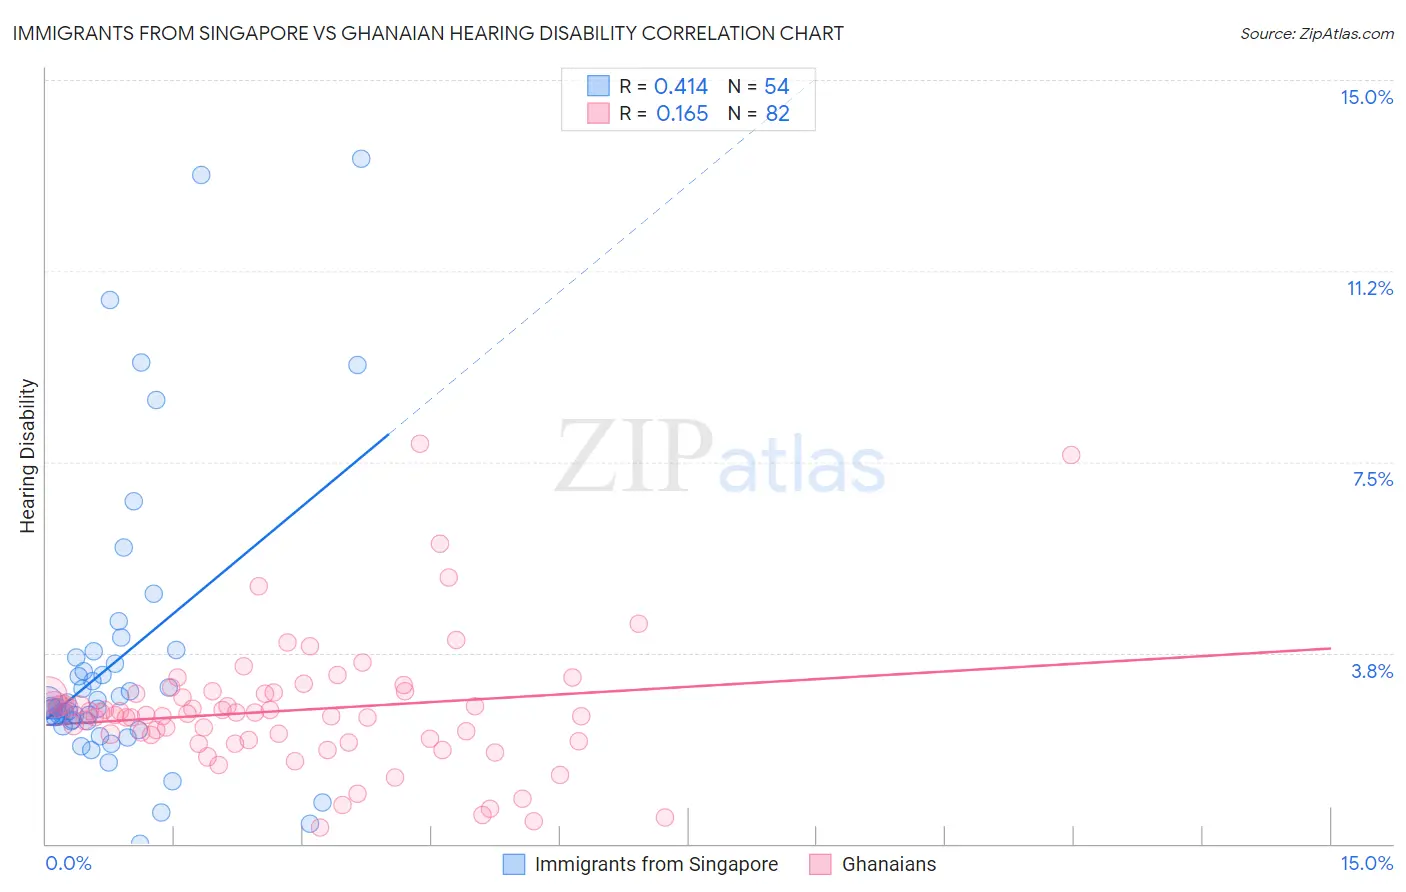
Immigrants from Singapore vs Ghanaian Hearing Disability Correlation Chart
The statistical analysis conducted on geographies consisting of 137,507,103 people shows a moderate positive correlation between the proportion of Immigrants from Singapore and percentage of population with hearing disability in the United States with a correlation coefficient (R) of 0.414 and weighted average of 2.6%. Similarly, the statistical analysis conducted on geographies consisting of 190,612,767 people shows a poor positive correlation between the proportion of Ghanaians and percentage of population with hearing disability in the United States with a correlation coefficient (R) of 0.165 and weighted average of 2.5%, a difference of 3.9%.
Hearing Disability Correlation Summary
| Measurement | Immigrants from Singapore | Ghanaian |
| Minimum | 0.0083% | 0.32% |
| Maximum | 13.5% | 7.9% |
| Range | 13.5% | 7.5% |
| Mean | 3.6% | 2.6% |
| Median | 2.7% | 2.5% |
| Interquartile 25% (IQ1) | 2.4% | 2.0% |
| Interquartile 75% (IQ3) | 3.7% | 3.0% |
| Interquartile Range (IQR) | 1.3% | 0.92% |
| Standard Deviation (Sample) | 2.9% | 1.3% |
| Standard Deviation (Population) | 2.8% | 1.3% |
Similar Demographics by Hearing Disability
Demographics Similar to Immigrants from Singapore by Hearing Disability
In terms of hearing disability, the demographic groups most similar to Immigrants from Singapore are Immigrants from Israel (2.6%, a difference of 0.070%), Immigrants from South America (2.7%, a difference of 0.12%), Immigrants from Dominica (2.6%, a difference of 0.21%), Paraguayan (2.7%, a difference of 0.31%), and Venezuelan (2.6%, a difference of 0.32%).
| Demographics | Rating | Rank | Hearing Disability |
| Immigrants | Taiwan | 99.4 /100 | #41 | Exceptional 2.6% |
| West Indians | 99.4 /100 | #42 | Exceptional 2.6% |
| Senegalese | 99.4 /100 | #43 | Exceptional 2.6% |
| Nigerians | 99.4 /100 | #44 | Exceptional 2.6% |
| Venezuelans | 99.4 /100 | #45 | Exceptional 2.6% |
| Immigrants | Dominica | 99.3 /100 | #46 | Exceptional 2.6% |
| Immigrants | Israel | 99.3 /100 | #47 | Exceptional 2.6% |
| Immigrants | Singapore | 99.3 /100 | #48 | Exceptional 2.6% |
| Immigrants | South America | 99.2 /100 | #49 | Exceptional 2.7% |
| Paraguayans | 99.2 /100 | #50 | Exceptional 2.7% |
| Immigrants | Hong Kong | 99.2 /100 | #51 | Exceptional 2.7% |
| Jamaicans | 99.0 /100 | #52 | Exceptional 2.7% |
| Immigrants | Eastern Asia | 99.0 /100 | #53 | Exceptional 2.7% |
| Ethiopians | 99.0 /100 | #54 | Exceptional 2.7% |
| Immigrants | Ethiopia | 99.0 /100 | #55 | Exceptional 2.7% |
Demographics Similar to Ghanaians by Hearing Disability
In terms of hearing disability, the demographic groups most similar to Ghanaians are Immigrants from Sierra Leone (2.6%, a difference of 0.040%), Immigrants from Bolivia (2.5%, a difference of 0.070%), Thai (2.5%, a difference of 0.11%), Dominican (2.5%, a difference of 0.14%), and Immigrants from Nigeria (2.6%, a difference of 0.54%).
| Demographics | Rating | Rank | Hearing Disability |
| Ecuadorians | 99.9 /100 | #14 | Exceptional 2.5% |
| Barbadians | 99.9 /100 | #15 | Exceptional 2.5% |
| Immigrants | West Indies | 99.9 /100 | #16 | Exceptional 2.5% |
| Immigrants | India | 99.9 /100 | #17 | Exceptional 2.5% |
| Dominicans | 99.8 /100 | #18 | Exceptional 2.5% |
| Thais | 99.8 /100 | #19 | Exceptional 2.5% |
| Immigrants | Bolivia | 99.8 /100 | #20 | Exceptional 2.5% |
| Ghanaians | 99.8 /100 | #21 | Exceptional 2.5% |
| Immigrants | Sierra Leone | 99.8 /100 | #22 | Exceptional 2.6% |
| Immigrants | Nigeria | 99.8 /100 | #23 | Exceptional 2.6% |
| Immigrants | Ghana | 99.8 /100 | #24 | Exceptional 2.6% |
| Immigrants | El Salvador | 99.7 /100 | #25 | Exceptional 2.6% |
| Immigrants | Senegal | 99.7 /100 | #26 | Exceptional 2.6% |
| Immigrants | South Central Asia | 99.7 /100 | #27 | Exceptional 2.6% |
| Immigrants | Haiti | 99.7 /100 | #28 | Exceptional 2.6% |