Immigrants from Serbia vs Immigrants Disability Age 65 to 74

COMPARE

Immigrants from Serbia
Race
Ancestry
AfghanAfricanAlaska NativeAlaskan AthabascanAlbanianAleutAlsatianAmericanApacheArabArapahoArgentineanArmenianAssyrian/Chaldean/SyriacAustralianAustrianBahamianBangladeshiBarbadianBasqueBelgianBelizeanBermudanBhutaneseBlackfeetBolivianBrazilianBritishBritish West IndianBulgarianBurmeseCajunCambodianCanadianCape VerdeanCarpatho RusynCelticCentral AmericanCentral American IndianCherokeeCheyenneChickasawChileanChineseChippewaChoctawColombianColvilleComancheCosta RicanCreeCreekCroatianCrowCubanCypriotCzechCzechoslovakianDanishDelawareDominicanDutchDutch West IndianEastern EuropeanEcuadorianEgyptianEnglishEstonianEthiopianEuropeanFijianFilipinoFinnishFrenchFrench American IndianFrench CanadianGermanGerman RussianGhanaianGreekGuamanian/ChamorroGuatemalanGuyaneseHaitianHmongHonduranHopiHoumaHungarianIcelanderIndian (Asian)IndonesianInupiatIranianIraqiIrishIroquoisIsraeliItalianJamaicanJapaneseJordanianKenyanKiowaKoreanLaotianLatvianLebaneseLiberianLithuanianLumbeeLuxembourgerMacedonianMalaysianMalteseMarshalleseMenomineeMexicanMexican American IndianMongolianMoroccanNative HawaiianNavajoNepaleseNew ZealanderNicaraguanNigerianNorthern EuropeanNorwegianOkinawanOsageOttawaPaiutePakistaniPalestinianPanamanianParaguayanPennsylvania GermanPeruvianPimaPolishPortuguesePotawatomiPuebloPuerto RicanPuget Sound SalishRomanianRussianSalvadoranSamoanScandinavianScotch-IrishScottishSeminoleSenegaleseSerbianShoshoneSierra LeoneanSiouxSlavicSlovakSloveneSomaliSouth AfricanSouth AmericanSouth American IndianSoviet UnionSpaniardSpanishSpanish AmericanSpanish American IndianSri LankanSubsaharan AfricanSudaneseSwedishSwissSyrianTaiwaneseThaiTlingit-HaidaTohono O'OdhamTonganTrinidadian and TobagonianTsimshianTurkishU.S. Virgin IslanderUgandanUkrainianUruguayanUteVenezuelanVietnameseWelshWest IndianYakamaYaquiYugoslavianYumanYup'ikZimbabwean
Immigration
NonimmigrantsAfghanistanAfricaAlbaniaArgentinaArmeniaAsiaAustraliaAustriaBahamasBangladeshBarbadosBelarusBelgiumBelizeBoliviaBosnia and HerzegovinaBrazilBulgariaBurma/MyanmarCabo VerdeCambodiaCameroonCanadaCaribbeanCentral AmericaChileChinaColombiaCongoCosta RicaCroatiaCubaCzechoslovakiaDenmarkDominicaDominican RepublicEastern AfricaEastern AsiaEastern EuropeEcuadorEgyptEl SalvadorEnglandEritreaEthiopiaEuropeFijiFranceGermanyGhanaGreeceGrenadaGuatemalaGuyanaHaitiHondurasHong KongHungaryIndiaIndonesiaIranIraqIrelandIsraelItalyJamaicaJapanJordanKazakhstanKenyaKoreaKuwaitLaosLatin AmericaLatviaLebanonLiberiaLithuaniaMalaysiaMexicoMicronesiaMiddle AfricaMoldovaMoroccoNepalNetherlandsNicaraguaNigeriaNorth AmericaNorth MacedoniaNorthern AfricaNorthern EuropeNorwayOceaniaPakistanPanamaPeruPhilippinesPolandPortugalRomaniaRussiaSaudi ArabiaScotlandSenegalSerbiaSierra LeoneSingaporeSomaliaSouth AfricaSouth AmericaSouth Central AsiaSouth Eastern AsiaSouthern EuropeSpainSri LankaSt. Vincent and the GrenadinesSudanSwedenSwitzerlandSyriaTaiwanThailandTrinidad and TobagoTurkeyUgandaUkraineUruguayUzbekistanVenezuelaVietnamWest IndiesWestern AfricaWestern AsiaWestern EuropeYemenZaireZimbabweAzores
Immigrants
Race
Ancestry
AfghanAfricanAlaska NativeAlaskan AthabascanAlbanianAleutAlsatianAmericanApacheArabArapahoArgentineanArmenianAssyrian/Chaldean/SyriacAustralianAustrianBahamianBangladeshiBarbadianBasqueBelgianBelizeanBermudanBhutaneseBlackfeetBolivianBrazilianBritishBritish West IndianBulgarianBurmeseCajunCambodianCanadianCape VerdeanCarpatho RusynCelticCentral AmericanCentral American IndianCherokeeCheyenneChickasawChileanChineseChippewaChoctawColombianColvilleComancheCosta RicanCreeCreekCroatianCrowCubanCypriotCzechCzechoslovakianDanishDelawareDominicanDutchDutch West IndianEastern EuropeanEcuadorianEgyptianEnglishEstonianEthiopianEuropeanFijianFilipinoFinnishFrenchFrench American IndianFrench CanadianGermanGerman RussianGhanaianGreekGuamanian/ChamorroGuatemalanGuyaneseHaitianHmongHonduranHopiHoumaHungarianIcelanderIndian (Asian)IndonesianInupiatIranianIraqiIrishIroquoisIsraeliItalianJamaicanJapaneseJordanianKenyanKiowaKoreanLaotianLatvianLebaneseLiberianLithuanianLumbeeLuxembourgerMacedonianMalaysianMalteseMarshalleseMenomineeMexicanMexican American IndianMongolianMoroccanNative HawaiianNavajoNepaleseNew ZealanderNicaraguanNigerianNorthern EuropeanNorwegianOkinawanOsageOttawaPaiutePakistaniPalestinianPanamanianParaguayanPennsylvania GermanPeruvianPimaPolishPortuguesePotawatomiPuebloPuerto RicanPuget Sound SalishRomanianRussianSalvadoranSamoanScandinavianScotch-IrishScottishSeminoleSenegaleseSerbianShoshoneSierra LeoneanSiouxSlavicSlovakSloveneSomaliSouth AfricanSouth AmericanSouth American IndianSoviet UnionSpaniardSpanishSpanish AmericanSpanish American IndianSri LankanSubsaharan AfricanSudaneseSwedishSwissSyrianTaiwaneseThaiTlingit-HaidaTohono O'OdhamTonganTrinidadian and TobagonianTsimshianTurkishU.S. Virgin IslanderUgandanUkrainianUruguayanUteVenezuelanVietnameseWelshWest IndianYakamaYaquiYugoslavianYumanYup'ikZimbabwean
Immigration
NonimmigrantsImmigrantsAfghanistanAfricaAlbaniaArgentinaArmeniaAsiaAustraliaAustriaBahamasBangladeshBarbadosBelarusBelgiumBelizeBoliviaBosnia and HerzegovinaBrazilBulgariaBurma/MyanmarCabo VerdeCambodiaCameroonCanadaCaribbeanCentral AmericaChileChinaColombiaCongoCosta RicaCroatiaCubaCzechoslovakiaDenmarkDominicaDominican RepublicEastern AfricaEastern AsiaEastern EuropeEcuadorEgyptEl SalvadorEnglandEritreaEthiopiaEuropeFijiFranceGermanyGhanaGreeceGrenadaGuatemalaGuyanaHaitiHondurasHong KongHungaryIndiaIndonesiaIranIraqIrelandIsraelItalyJamaicaJapanJordanKazakhstanKenyaKoreaKuwaitLaosLatin AmericaLatviaLebanonLiberiaLithuaniaMalaysiaMexicoMicronesiaMiddle AfricaMoldovaMoroccoNepalNetherlandsNicaraguaNigeriaNorth AmericaNorth MacedoniaNorthern AfricaNorthern EuropeNorwayOceaniaPakistanPanamaPeruPhilippinesPolandPortugalRomaniaRussiaSaudi ArabiaScotlandSenegalSierra LeoneSingaporeSomaliaSouth AfricaSouth AmericaSouth Central AsiaSouth Eastern AsiaSouthern EuropeSpainSri LankaSt. Vincent and the GrenadinesSudanSwedenSwitzerlandSyriaTaiwanThailandTrinidad and TobagoTurkeyUgandaUkraineUruguayUzbekistanVenezuelaVietnamWest IndiesWestern AfricaWestern AsiaWestern EuropeYemenZaireZimbabweAzores
Disability Age 65 to 74
Income
Poverty
Unemployment
Labor Participation
Family Structure
Vehicle Availability
Education Level
Disability

Disability Age 65 to 74 Comparison

Immigrants from Serbia

Immigrants

Exceptional
Fair
21.4%
DISABILITY AGE 65 TO 74
99.6/ 100
METRIC RATING
51st/ 347
METRIC RANK
23.7%
DISABILITY AGE 65 TO 74
25.8/ 100
METRIC RATING
197th/ 347
METRIC RANK

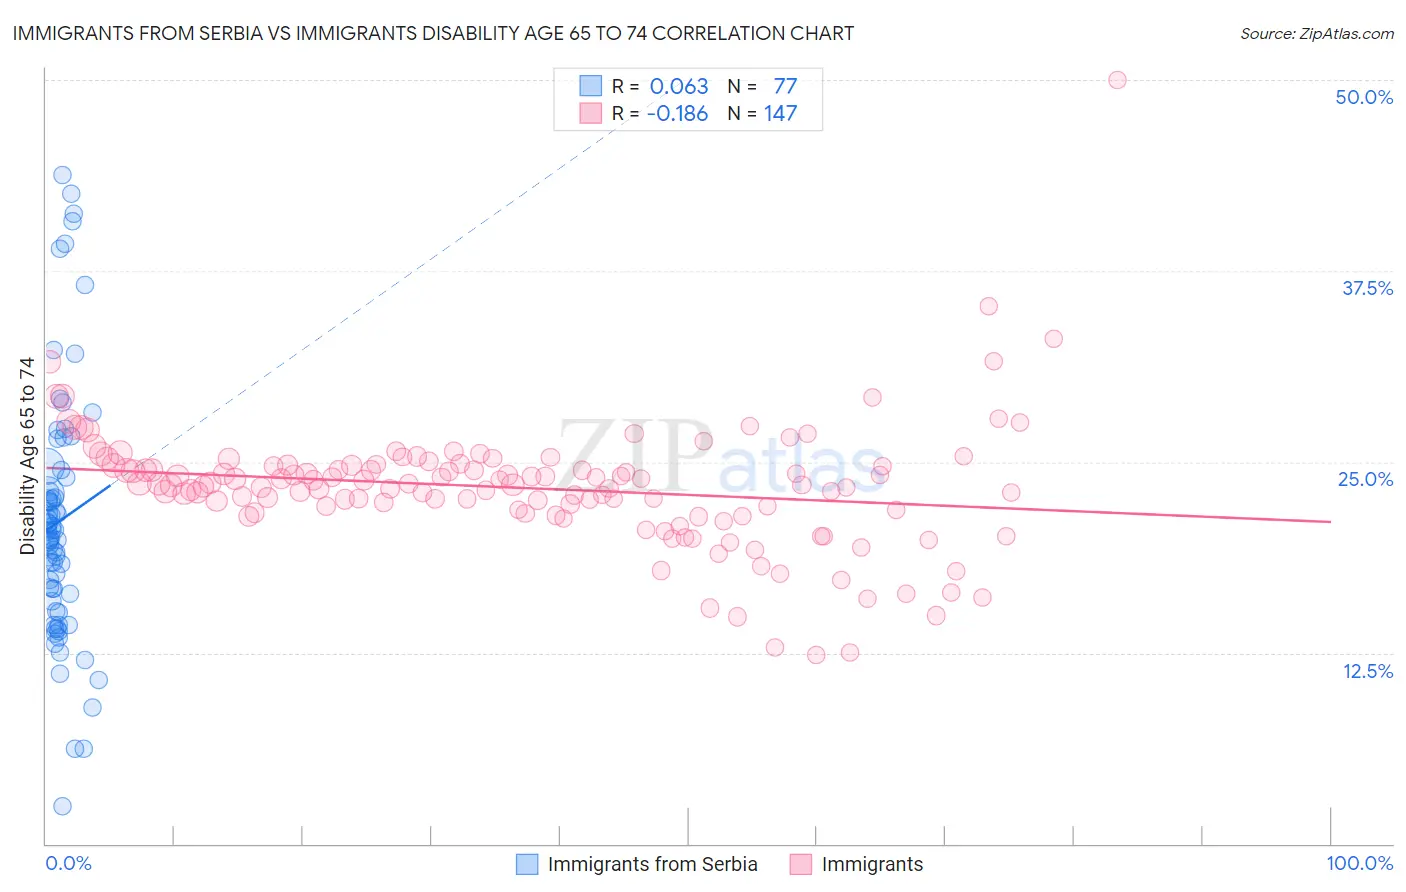
Immigrants from Serbia vs Immigrants Disability Age 65 to 74 Correlation Chart

The statistical analysis conducted on geographies consisting of 131,669,066 people shows a slight positive correlation between the proportion of Immigrants from Serbia and percentage of population with a disability between the ages 65 and 75 in the United States with a correlation coefficient (R) of 0.063 and weighted average of 21.4%. Similarly, the statistical analysis conducted on geographies consisting of 574,995,513 people shows a poor negative correlation between the proportion of Immigrants and percentage of population with a disability between the ages 65 and 75 in the United States with a correlation coefficient (R) of -0.186 and weighted average of 23.7%, a difference of 10.5%.
Immigrants from Serbia vs Immigrants Disability Age 65 to 74

Disability Age 65 to 74 Correlation Summary

MeasurementImmigrants from SerbiaImmigrants
Minimum2.5%12.3%
Maximum43.7%50.0%
Range41.3%37.7%
Mean21.1%23.3%
Median20.0%23.5%
Interquartile 25% (IQ1)15.6%21.7%
Interquartile 75% (IQ3)24.2%24.8%
Interquartile Range (IQR)8.6%3.1%
Standard Deviation (Sample)8.4%4.2%
Standard Deviation (Population)8.3%4.2%

Similar Demographics by Disability Age 65 to 74

Demographics Similar to Immigrants from Serbia by Disability Age 65 to 74

In terms of disability age 65 to 74, the demographic groups most similar to Immigrants from Serbia are Immigrants from Malaysia (21.4%, a difference of 0.22%), Immigrants from France (21.5%, a difference of 0.22%), Bhutanese (21.5%, a difference of 0.23%), Immigrants from Italy (21.5%, a difference of 0.24%), and Luxembourger (21.4%, a difference of 0.25%).
DemographicsRating | RankDisability Age 65 to 74
Estonians
99.7
/100
|
#44
Exceptional
21.4%
Asians
99.7
/100
|
#45
Exceptional
21.4%
Immigrants | Turkey
99.7
/100
|
#46
Exceptional
21.4%
Immigrants | Bulgaria
99.7
/100
|
#47
Exceptional
21.4%
Lithuanians
99.7
/100
|
#48
Exceptional
21.4%
Luxembourgers
99.7
/100
|
#49
Exceptional
21.4%
Immigrants | Malaysia
99.7
/100
|
#50
Exceptional
21.4%
Immigrants | Serbia
99.6
/100
|
#51
Exceptional
21.4%
Immigrants | France
99.6
/100
|
#52
Exceptional
21.5%
Bhutanese
99.6
/100
|
#53
Exceptional
21.5%
Immigrants | Italy
99.6
/100
|
#54
Exceptional
21.5%
Immigrants | Romania
99.5
/100
|
#55
Exceptional
21.5%
Immigrants | Denmark
99.5
/100
|
#56
Exceptional
21.5%
Immigrants | Asia
99.5
/100
|
#57
Exceptional
21.5%
Immigrants | Pakistan
99.5
/100
|
#58
Exceptional
21.5%

Demographics Similar to Immigrants by Disability Age 65 to 74

In terms of disability age 65 to 74, the demographic groups most similar to Immigrants are Immigrants from St. Vincent and the Grenadines (23.7%, a difference of 0.020%), Immigrants from Trinidad and Tobago (23.7%, a difference of 0.020%), Immigrants from Africa (23.7%, a difference of 0.11%), Welsh (23.7%, a difference of 0.11%), and French Canadian (23.7%, a difference of 0.14%).
DemographicsRating | RankDisability Age 65 to 74
Immigrants | Guyana
31.2
/100
|
#190
Fair
23.6%
Immigrants | Bangladesh
30.2
/100
|
#191
Fair
23.6%
Ecuadorians
29.7
/100
|
#192
Fair
23.6%
English
28.5
/100
|
#193
Fair
23.6%
Sudanese
27.8
/100
|
#194
Fair
23.7%
Immigrants | St. Vincent and the Grenadines
26.1
/100
|
#195
Fair
23.7%
Immigrants | Trinidad and Tobago
26.1
/100
|
#196
Fair
23.7%
Immigrants | Immigrants
25.8
/100
|
#197
Fair
23.7%
Immigrants | Africa
24.4
/100
|
#198
Fair
23.7%
Welsh
24.3
/100
|
#199
Fair
23.7%
French Canadians
24.0
/100
|
#200
Fair
23.7%
Immigrants | Ecuador
23.9
/100
|
#201
Fair
23.7%
Immigrants | Bahamas
23.3
/100
|
#202
Fair
23.7%
Kenyans
23.2
/100
|
#203
Fair
23.7%
Immigrants | Grenada
22.1
/100
|
#204
Fair
23.8%