Immigrants from Russia vs Ukrainian Hearing Disability
COMPARE
Immigrants from Russia
Ukrainian
Hearing Disability
Hearing Disability Comparison
Immigrants from Russia
Ukrainians
2.9%
HEARING DISABILITY
77.7/ 100
METRIC RATING
148th/ 347
METRIC RANK
3.2%
HEARING DISABILITY
2.9/ 100
METRIC RATING
232nd/ 347
METRIC RANK
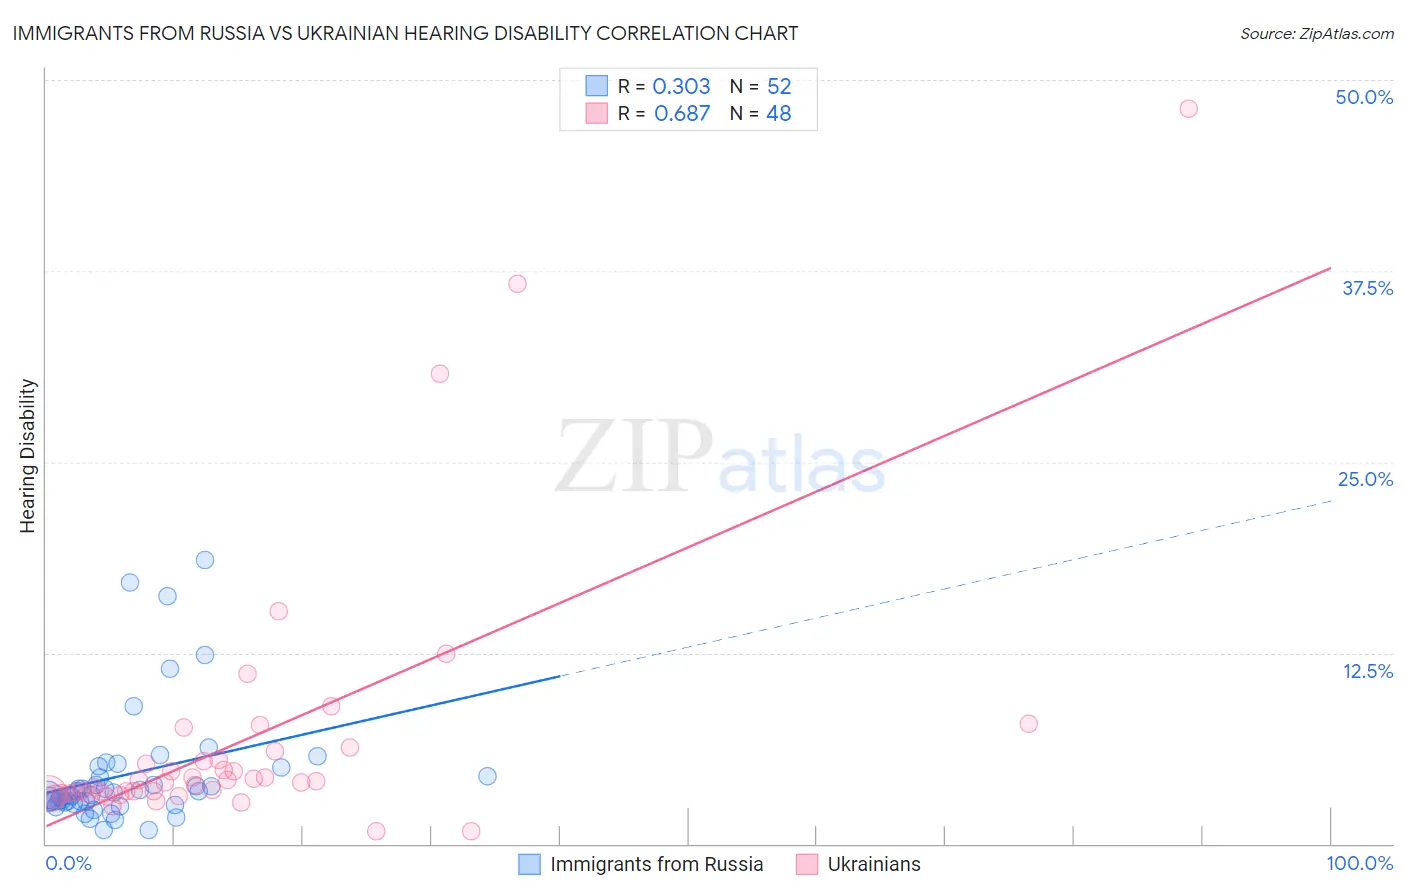
Immigrants from Russia vs Ukrainian Hearing Disability Correlation Chart
The statistical analysis conducted on geographies consisting of 347,834,739 people shows a mild positive correlation between the proportion of Immigrants from Russia and percentage of population with hearing disability in the United States with a correlation coefficient (R) of 0.303 and weighted average of 2.9%. Similarly, the statistical analysis conducted on geographies consisting of 448,464,085 people shows a significant positive correlation between the proportion of Ukrainians and percentage of population with hearing disability in the United States with a correlation coefficient (R) of 0.687 and weighted average of 3.2%, a difference of 11.5%.
Hearing Disability Correlation Summary
| Measurement | Immigrants from Russia | Ukrainian |
| Minimum | 0.87% | 0.79% |
| Maximum | 18.5% | 48.1% |
| Range | 17.7% | 47.4% |
| Mean | 4.5% | 6.9% |
| Median | 3.3% | 4.1% |
| Interquartile 25% (IQ1) | 2.7% | 3.3% |
| Interquartile 75% (IQ3) | 4.7% | 5.8% |
| Interquartile Range (IQR) | 1.9% | 2.5% |
| Standard Deviation (Sample) | 3.9% | 8.9% |
| Standard Deviation (Population) | 3.8% | 8.8% |
Similar Demographics by Hearing Disability
Demographics Similar to Immigrants from Russia by Hearing Disability
In terms of hearing disability, the demographic groups most similar to Immigrants from Russia are Immigrants from Panama (2.9%, a difference of 0.11%), Tongan (2.9%, a difference of 0.13%), Brazilian (2.9%, a difference of 0.15%), Immigrants from Congo (2.9%, a difference of 0.17%), and Immigrants from Bulgaria (2.9%, a difference of 0.21%).
| Demographics | Rating | Rank | Hearing Disability |
| Sub-Saharan Africans | 83.3 /100 | #141 | Excellent 2.9% |
| Laotians | 81.1 /100 | #142 | Excellent 2.9% |
| Immigrants | Bahamas | 80.9 /100 | #143 | Excellent 2.9% |
| Immigrants | Bulgaria | 79.2 /100 | #144 | Good 2.9% |
| Immigrants | Congo | 78.9 /100 | #145 | Good 2.9% |
| Brazilians | 78.7 /100 | #146 | Good 2.9% |
| Tongans | 78.6 /100 | #147 | Good 2.9% |
| Immigrants | Russia | 77.7 /100 | #148 | Good 2.9% |
| Immigrants | Panama | 76.9 /100 | #149 | Good 2.9% |
| Palestinians | 73.6 /100 | #150 | Good 2.9% |
| Immigrants | France | 73.1 /100 | #151 | Good 2.9% |
| Immigrants | Lithuania | 73.0 /100 | #152 | Good 2.9% |
| Sudanese | 72.1 /100 | #153 | Good 2.9% |
| Immigrants | Lebanon | 71.5 /100 | #154 | Good 2.9% |
| Costa Ricans | 71.4 /100 | #155 | Good 2.9% |
Demographics Similar to Ukrainians by Hearing Disability
In terms of hearing disability, the demographic groups most similar to Ukrainians are Luxembourger (3.2%, a difference of 0.050%), Greek (3.2%, a difference of 0.28%), Estonian (3.3%, a difference of 0.37%), Central American Indian (3.3%, a difference of 0.44%), and Guamanian/Chamorro (3.3%, a difference of 0.55%).
| Demographics | Rating | Rank | Hearing Disability |
| Latvians | 5.1 /100 | #225 | Tragic 3.2% |
| Lebanese | 5.0 /100 | #226 | Tragic 3.2% |
| Bhutanese | 4.6 /100 | #227 | Tragic 3.2% |
| Immigrants | Portugal | 4.3 /100 | #228 | Tragic 3.2% |
| Maltese | 4.1 /100 | #229 | Tragic 3.2% |
| Greeks | 3.2 /100 | #230 | Tragic 3.2% |
| Luxembourgers | 2.9 /100 | #231 | Tragic 3.2% |
| Ukrainians | 2.9 /100 | #232 | Tragic 3.2% |
| Estonians | 2.4 /100 | #233 | Tragic 3.3% |
| Central American Indians | 2.3 /100 | #234 | Tragic 3.3% |
| Guamanians/Chamorros | 2.2 /100 | #235 | Tragic 3.3% |
| Serbians | 2.2 /100 | #236 | Tragic 3.3% |
| Immigrants | Austria | 1.8 /100 | #237 | Tragic 3.3% |
| German Russians | 1.8 /100 | #238 | Tragic 3.3% |
| Nepalese | 1.2 /100 | #239 | Tragic 3.3% |