Immigrants from Russia vs Burmese Disability Age Over 75

COMPARE

Immigrants from Russia
Race
Ancestry
AfghanAfricanAlaska NativeAlaskan AthabascanAlbanianAleutAlsatianAmericanApacheArabArapahoArgentineanArmenianAssyrian/Chaldean/SyriacAustralianAustrianBahamianBangladeshiBarbadianBasqueBelgianBelizeanBermudanBhutaneseBlackfeetBolivianBrazilianBritishBritish West IndianBulgarianCajunCambodianCanadianCape VerdeanCarpatho RusynCelticCentral AmericanCentral American IndianCherokeeCheyenneChickasawChileanChineseChippewaChoctawColombianColvilleComancheCosta RicanCreeCreekCroatianCrowCubanCypriotCzechCzechoslovakianDanishDelawareDominicanDutchDutch West IndianEastern EuropeanEcuadorianEgyptianEnglishEstonianEthiopianEuropeanFijianFilipinoFinnishFrenchFrench American IndianFrench CanadianGermanGerman RussianGhanaianGreekGuamanian/ChamorroGuatemalanGuyaneseHaitianHmongHonduranHopiHoumaHungarianIcelanderIndian (Asian)IndonesianInupiatIranianIraqiIrishIroquoisIsraeliItalianJamaicanJapaneseJordanianKenyanKiowaKoreanLaotianLatvianLebaneseLiberianLithuanianLumbeeLuxembourgerMacedonianMalaysianMalteseMarshalleseMenomineeMexicanMexican American IndianMongolianMoroccanNative HawaiianNavajoNepaleseNew ZealanderNicaraguanNigerianNorthern EuropeanNorwegianOkinawanOsageOttawaPaiutePakistaniPalestinianPanamanianParaguayanPennsylvania GermanPeruvianPimaPolishPortuguesePotawatomiPuebloPuerto RicanPuget Sound SalishRomanianRussianSalvadoranSamoanScandinavianScotch-IrishScottishSeminoleSenegaleseSerbianShoshoneSierra LeoneanSiouxSlavicSlovakSloveneSomaliSouth AfricanSouth AmericanSouth American IndianSoviet UnionSpaniardSpanishSpanish AmericanSpanish American IndianSri LankanSubsaharan AfricanSudaneseSwedishSwissSyrianTaiwaneseThaiTlingit-HaidaTohono O'OdhamTonganTrinidadian and TobagonianTsimshianTurkishU.S. Virgin IslanderUgandanUkrainianUruguayanUteVenezuelanVietnameseWelshWest IndianYakamaYaquiYugoslavianYumanYup'ikZimbabwean
Immigration
NonimmigrantsImmigrantsAfghanistanAfricaAlbaniaArgentinaArmeniaAsiaAustraliaAustriaBahamasBangladeshBarbadosBelarusBelgiumBelizeBoliviaBosnia and HerzegovinaBrazilBulgariaBurma/MyanmarCabo VerdeCambodiaCameroonCanadaCaribbeanCentral AmericaChileChinaColombiaCongoCosta RicaCroatiaCubaCzechoslovakiaDenmarkDominicaDominican RepublicEastern AfricaEastern AsiaEastern EuropeEcuadorEgyptEl SalvadorEnglandEritreaEthiopiaEuropeFijiFranceGermanyGhanaGreeceGrenadaGuatemalaGuyanaHaitiHondurasHong KongHungaryIndiaIndonesiaIranIraqIrelandIsraelItalyJamaicaJapanJordanKazakhstanKenyaKoreaKuwaitLaosLatin AmericaLatviaLebanonLiberiaLithuaniaMalaysiaMexicoMicronesiaMiddle AfricaMoldovaMoroccoNepalNetherlandsNicaraguaNigeriaNorth AmericaNorth MacedoniaNorthern AfricaNorthern EuropeNorwayOceaniaPakistanPanamaPeruPhilippinesPolandPortugalRomaniaRussiaSaudi ArabiaScotlandSenegalSerbiaSierra LeoneSingaporeSomaliaSouth AfricaSouth AmericaSouth Central AsiaSouth Eastern AsiaSouthern EuropeSpainSri LankaSt. Vincent and the GrenadinesSudanSwedenSwitzerlandSyriaTaiwanThailandTrinidad and TobagoTurkeyUgandaUkraineUruguayUzbekistanVenezuelaVietnamWest IndiesWestern AfricaWestern AsiaWestern EuropeYemenZaireZimbabweAzores
Burmese
Race
Ancestry
AfghanAfricanAlaska NativeAlaskan AthabascanAlbanianAleutAlsatianAmericanApacheArabArapahoArgentineanArmenianAssyrian/Chaldean/SyriacAustralianAustrianBahamianBangladeshiBarbadianBasqueBelgianBelizeanBermudanBhutaneseBlackfeetBolivianBrazilianBritishBritish West IndianBulgarianBurmeseCajunCambodianCanadianCape VerdeanCarpatho RusynCelticCentral AmericanCentral American IndianCherokeeCheyenneChickasawChileanChineseChippewaChoctawColombianColvilleComancheCosta RicanCreeCreekCroatianCrowCubanCypriotCzechCzechoslovakianDanishDelawareDominicanDutchDutch West IndianEastern EuropeanEcuadorianEgyptianEnglishEstonianEthiopianEuropeanFijianFilipinoFinnishFrenchFrench American IndianFrench CanadianGermanGerman RussianGhanaianGreekGuamanian/ChamorroGuatemalanGuyaneseHaitianHmongHonduranHopiHoumaHungarianIcelanderIndian (Asian)IndonesianInupiatIranianIraqiIrishIroquoisIsraeliItalianJamaicanJapaneseJordanianKenyanKiowaKoreanLaotianLatvianLebaneseLiberianLithuanianLumbeeLuxembourgerMacedonianMalaysianMalteseMarshalleseMenomineeMexicanMexican American IndianMongolianMoroccanNative HawaiianNavajoNepaleseNew ZealanderNicaraguanNigerianNorthern EuropeanNorwegianOkinawanOsageOttawaPaiutePakistaniPalestinianPanamanianParaguayanPennsylvania GermanPeruvianPimaPolishPortuguesePotawatomiPuebloPuerto RicanPuget Sound SalishRomanianRussianSalvadoranSamoanScandinavianScotch-IrishScottishSeminoleSenegaleseSerbianShoshoneSierra LeoneanSiouxSlavicSlovakSloveneSomaliSouth AfricanSouth AmericanSouth American IndianSoviet UnionSpaniardSpanishSpanish AmericanSpanish American IndianSri LankanSubsaharan AfricanSudaneseSwedishSwissSyrianTaiwaneseThaiTlingit-HaidaTohono O'OdhamTonganTrinidadian and TobagonianTsimshianTurkishU.S. Virgin IslanderUgandanUkrainianUruguayanUteVenezuelanVietnameseWelshWest IndianYakamaYaquiYugoslavianYumanYup'ikZimbabwean
Immigration
NonimmigrantsImmigrantsAfghanistanAfricaAlbaniaArgentinaArmeniaAsiaAustraliaAustriaBahamasBangladeshBarbadosBelarusBelgiumBelizeBoliviaBosnia and HerzegovinaBrazilBulgariaBurma/MyanmarCabo VerdeCambodiaCameroonCanadaCaribbeanCentral AmericaChileChinaColombiaCongoCosta RicaCroatiaCubaCzechoslovakiaDenmarkDominicaDominican RepublicEastern AfricaEastern AsiaEastern EuropeEcuadorEgyptEl SalvadorEnglandEritreaEthiopiaEuropeFijiFranceGermanyGhanaGreeceGrenadaGuatemalaGuyanaHaitiHondurasHong KongHungaryIndiaIndonesiaIranIraqIrelandIsraelItalyJamaicaJapanJordanKazakhstanKenyaKoreaKuwaitLaosLatin AmericaLatviaLebanonLiberiaLithuaniaMalaysiaMexicoMicronesiaMiddle AfricaMoldovaMoroccoNepalNetherlandsNicaraguaNigeriaNorth AmericaNorth MacedoniaNorthern AfricaNorthern EuropeNorwayOceaniaPakistanPanamaPeruPhilippinesPolandPortugalRomaniaSaudi ArabiaScotlandSenegalSerbiaSierra LeoneSingaporeSomaliaSouth AfricaSouth AmericaSouth Central AsiaSouth Eastern AsiaSouthern EuropeSpainSri LankaSt. Vincent and the GrenadinesSudanSwedenSwitzerlandSyriaTaiwanThailandTrinidad and TobagoTurkeyUgandaUkraineUruguayUzbekistanVenezuelaVietnamWest IndiesWestern AfricaWestern AsiaWestern EuropeYemenZaireZimbabweAzores
Disability Age Over 75
Income
Poverty
Unemployment
Labor Participation
Family Structure
Vehicle Availability
Education Level
Disability

Disability Age Over 75 Comparison

Immigrants from Russia

Burmese

Good
Exceptional
47.0%
DISABILITY AGE OVER 75
79.3/ 100
METRIC RATING
150th/ 347
METRIC RANK
45.9%
DISABILITY AGE OVER 75
99.5/ 100
METRIC RATING
62nd/ 347
METRIC RANK

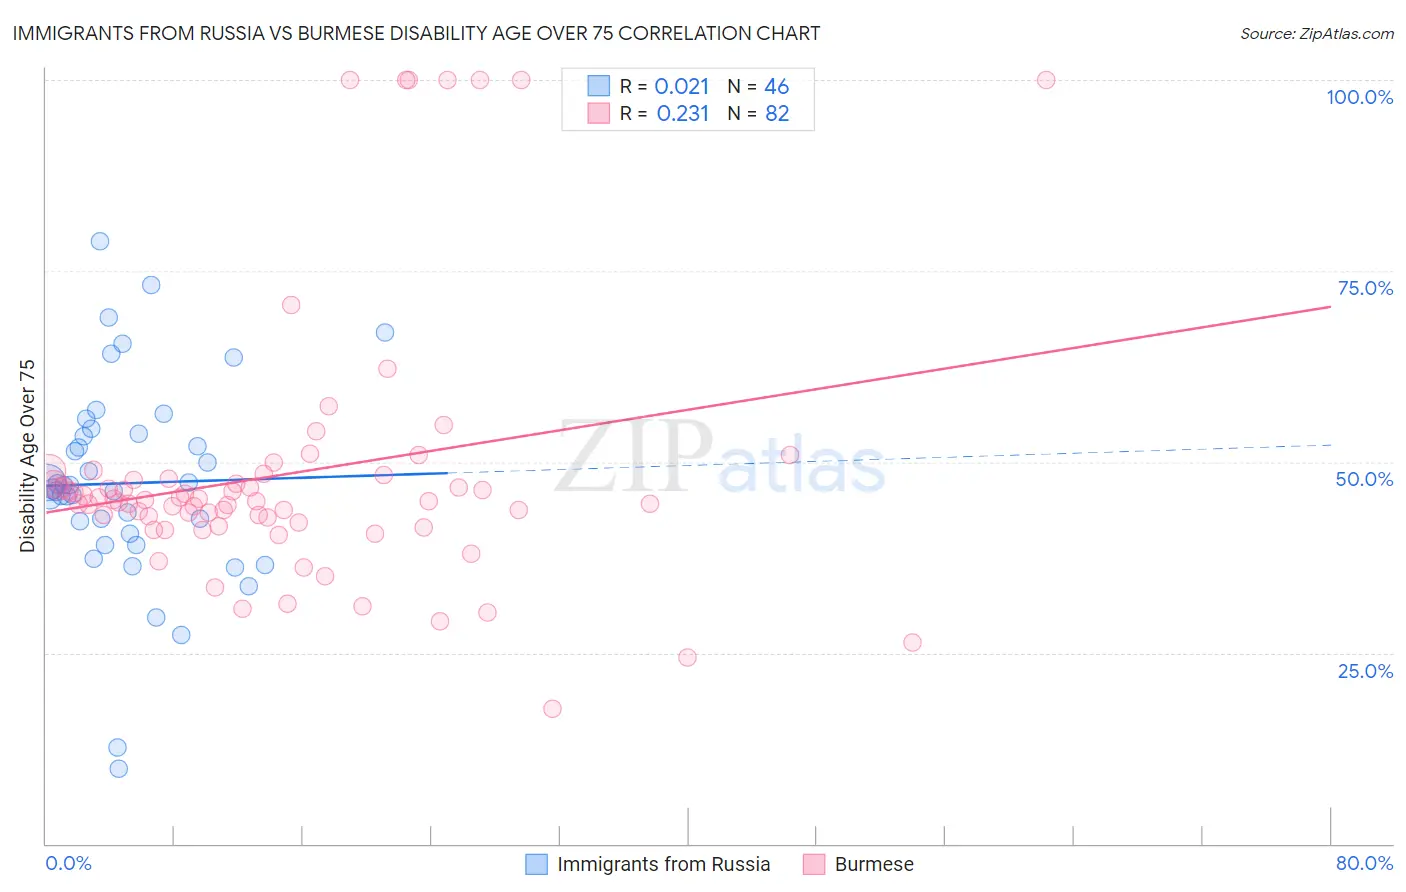
Immigrants from Russia vs Burmese Disability Age Over 75 Correlation Chart

The statistical analysis conducted on geographies consisting of 347,296,356 people shows no correlation between the proportion of Immigrants from Russia and percentage of population with a disability over the age of 75 in the United States with a correlation coefficient (R) of 0.021 and weighted average of 47.0%. Similarly, the statistical analysis conducted on geographies consisting of 463,970,259 people shows a weak positive correlation between the proportion of Burmese and percentage of population with a disability over the age of 75 in the United States with a correlation coefficient (R) of 0.231 and weighted average of 45.9%, a difference of 2.3%.
Immigrants from Russia vs Burmese Disability Age Over 75

Disability Age Over 75 Correlation Summary

MeasurementImmigrants from RussiaBurmese
Minimum9.8%17.7%
Maximum78.9%100.0%
Range69.1%82.3%
Mean47.2%48.5%
Median46.7%44.9%
Interquartile 25% (IQ1)40.6%42.1%
Interquartile 75% (IQ3)53.7%47.8%
Interquartile Range (IQR)13.0%5.7%
Standard Deviation (Sample)13.4%17.5%
Standard Deviation (Population)13.3%17.4%

Similar Demographics by Disability Age Over 75

Demographics Similar to Immigrants from Russia by Disability Age Over 75

In terms of disability age over 75, the demographic groups most similar to Immigrants from Russia are French Canadian (47.0%, a difference of 0.010%), Welsh (47.0%, a difference of 0.070%), Asian (46.9%, a difference of 0.080%), Immigrants from Asia (47.0%, a difference of 0.090%), and Immigrants from Zaire (47.1%, a difference of 0.14%).
DemographicsRating | RankDisability Age Over 75
Bermudans
85.6
/100
|
#143
Excellent
46.9%
Venezuelans
85.0
/100
|
#144
Excellent
46.9%
Costa Ricans
84.5
/100
|
#145
Excellent
46.9%
Guyanese
84.3
/100
|
#146
Excellent
46.9%
Immigrants | Peru
84.1
/100
|
#147
Excellent
46.9%
Asians
81.6
/100
|
#148
Excellent
46.9%
Welsh
81.3
/100
|
#149
Excellent
47.0%
Immigrants | Russia
79.3
/100
|
#150
Good
47.0%
French Canadians
79.0
/100
|
#151
Good
47.0%
Immigrants | Asia
76.5
/100
|
#152
Good
47.0%
Immigrants | Zaire
74.8
/100
|
#153
Good
47.1%
Immigrants | Belarus
74.8
/100
|
#154
Good
47.1%
Immigrants | Iran
74.7
/100
|
#155
Good
47.1%
Arabs
73.3
/100
|
#156
Good
47.1%
Bhutanese
72.6
/100
|
#157
Good
47.1%

Demographics Similar to Burmese by Disability Age Over 75

In terms of disability age over 75, the demographic groups most similar to Burmese are Immigrants from Argentina (45.9%, a difference of 0.030%), Iranian (45.9%, a difference of 0.050%), Immigrants from Europe (45.9%, a difference of 0.050%), Immigrants from Norway (45.9%, a difference of 0.050%), and Immigrants from North Macedonia (45.9%, a difference of 0.050%).
DemographicsRating | RankDisability Age Over 75
Maltese
99.6
/100
|
#55
Exceptional
45.8%
Immigrants | Netherlands
99.6
/100
|
#56
Exceptional
45.9%
Immigrants | Turkey
99.6
/100
|
#57
Exceptional
45.9%
Immigrants | Israel
99.6
/100
|
#58
Exceptional
45.9%
Iranians
99.6
/100
|
#59
Exceptional
45.9%
Immigrants | Europe
99.6
/100
|
#60
Exceptional
45.9%
Immigrants | Argentina
99.6
/100
|
#61
Exceptional
45.9%
Burmese
99.5
/100
|
#62
Exceptional
45.9%
Immigrants | Norway
99.5
/100
|
#63
Exceptional
45.9%
Immigrants | North Macedonia
99.5
/100
|
#64
Exceptional
45.9%
Austrians
99.5
/100
|
#65
Exceptional
46.0%
Immigrants | England
99.5
/100
|
#66
Exceptional
46.0%
Immigrants | Spain
99.4
/100
|
#67
Exceptional
46.0%
Immigrants | South Central Asia
99.4
/100
|
#68
Exceptional
46.0%
Immigrants | Romania
99.3
/100
|
#69
Exceptional
46.0%