Immigrants from Portugal vs Marshallese Disability Age Over 75
COMPARE
Immigrants from Portugal
Marshallese
Disability Age Over 75
Disability Age Over 75 Comparison
Immigrants from Portugal
Marshallese
47.6%
DISABILITY AGE OVER 75
23.8/ 100
METRIC RATING
196th/ 347
METRIC RANK
50.1%
DISABILITY AGE OVER 75
0.0/ 100
METRIC RATING
298th/ 347
METRIC RANK
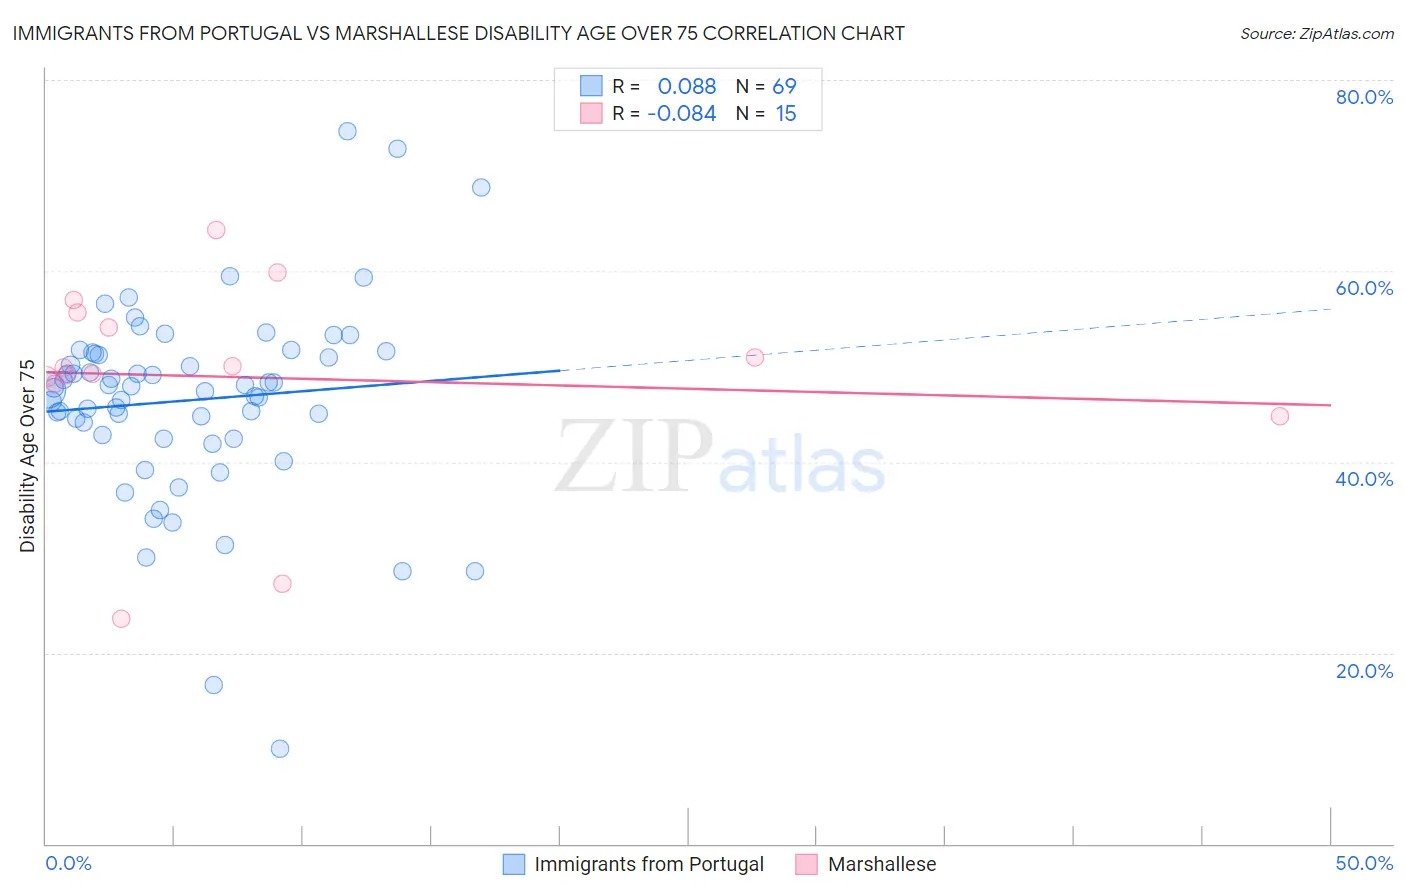
Immigrants from Portugal vs Marshallese Disability Age Over 75 Correlation Chart
The statistical analysis conducted on geographies consisting of 174,707,158 people shows a slight positive correlation between the proportion of Immigrants from Portugal and percentage of population with a disability over the age of 75 in the United States with a correlation coefficient (R) of 0.088 and weighted average of 47.6%. Similarly, the statistical analysis conducted on geographies consisting of 14,759,035 people shows a slight negative correlation between the proportion of Marshallese and percentage of population with a disability over the age of 75 in the United States with a correlation coefficient (R) of -0.084 and weighted average of 50.1%, a difference of 5.1%.
Disability Age Over 75 Correlation Summary
| Measurement | Immigrants from Portugal | Marshallese |
| Minimum | 10.0% | 23.5% |
| Maximum | 74.7% | 64.3% |
| Range | 64.7% | 40.8% |
| Mean | 46.5% | 48.9% |
| Median | 47.7% | 49.9% |
| Interquartile 25% (IQ1) | 42.6% | 48.2% |
| Interquartile 75% (IQ3) | 51.4% | 55.7% |
| Interquartile Range (IQR) | 8.8% | 7.5% |
| Standard Deviation (Sample) | 10.4% | 10.8% |
| Standard Deviation (Population) | 10.3% | 10.4% |
Similar Demographics by Disability Age Over 75
Demographics Similar to Immigrants from Portugal by Disability Age Over 75
In terms of disability age over 75, the demographic groups most similar to Immigrants from Portugal are Pakistani (47.7%, a difference of 0.010%), Immigrants from Ukraine (47.7%, a difference of 0.020%), Immigrants from Eritrea (47.7%, a difference of 0.040%), Immigrants from Trinidad and Tobago (47.6%, a difference of 0.050%), and Immigrants from Lebanon (47.6%, a difference of 0.080%).
| Demographics | Rating | Rank | Disability Age Over 75 |
| Immigrants | Kenya | 30.8 /100 | #189 | Fair 47.6% |
| Somalis | 29.5 /100 | #190 | Fair 47.6% |
| Portuguese | 29.3 /100 | #191 | Fair 47.6% |
| Immigrants | Jamaica | 28.3 /100 | #192 | Fair 47.6% |
| Ottawa | 28.1 /100 | #193 | Fair 47.6% |
| Immigrants | Lebanon | 26.5 /100 | #194 | Fair 47.6% |
| Immigrants | Trinidad and Tobago | 25.3 /100 | #195 | Fair 47.6% |
| Immigrants | Portugal | 23.8 /100 | #196 | Fair 47.6% |
| Pakistanis | 23.4 /100 | #197 | Fair 47.7% |
| Immigrants | Ukraine | 23.2 /100 | #198 | Fair 47.7% |
| Immigrants | Eritrea | 22.4 /100 | #199 | Fair 47.7% |
| Immigrants | Somalia | 21.4 /100 | #200 | Fair 47.7% |
| Immigrants | Cuba | 20.9 /100 | #201 | Fair 47.7% |
| Immigrants | Bahamas | 20.7 /100 | #202 | Fair 47.7% |
| Trinidadians and Tobagonians | 20.0 /100 | #203 | Fair 47.7% |
Demographics Similar to Marshallese by Disability Age Over 75
In terms of disability age over 75, the demographic groups most similar to Marshallese are Armenian (50.0%, a difference of 0.050%), Immigrants from Micronesia (50.1%, a difference of 0.070%), Mexican American Indian (50.0%, a difference of 0.080%), Cape Verdean (50.1%, a difference of 0.10%), and Spanish American (50.0%, a difference of 0.12%).
| Demographics | Rating | Rank | Disability Age Over 75 |
| Arapaho | 0.0 /100 | #291 | Tragic 49.8% |
| Shoshone | 0.0 /100 | #292 | Tragic 49.9% |
| Spanish American Indians | 0.0 /100 | #293 | Tragic 49.9% |
| Immigrants | Cambodia | 0.0 /100 | #294 | Tragic 50.0% |
| Spanish Americans | 0.0 /100 | #295 | Tragic 50.0% |
| Mexican American Indians | 0.0 /100 | #296 | Tragic 50.0% |
| Armenians | 0.0 /100 | #297 | Tragic 50.0% |
| Marshallese | 0.0 /100 | #298 | Tragic 50.1% |
| Immigrants | Micronesia | 0.0 /100 | #299 | Tragic 50.1% |
| Cape Verdeans | 0.0 /100 | #300 | Tragic 50.1% |
| Dominicans | 0.0 /100 | #301 | Tragic 50.2% |
| Cherokee | 0.0 /100 | #302 | Tragic 50.2% |
| Japanese | 0.0 /100 | #303 | Tragic 50.2% |
| Immigrants | Dominican Republic | 0.0 /100 | #304 | Tragic 50.3% |
| Central American Indians | 0.0 /100 | #305 | Tragic 50.5% |