Immigrants from Panama vs Immigrants from Oceania Disability Age 65 to 74
COMPARE
Immigrants from Panama
Immigrants from Oceania
Disability Age 65 to 74
Disability Age 65 to 74 Comparison
Immigrants from Panama
Immigrants from Oceania
24.1%
DISABILITY AGE 65 TO 74
8.6/ 100
METRIC RATING
224th/ 347
METRIC RANK
24.0%
DISABILITY AGE 65 TO 74
13.6/ 100
METRIC RATING
214th/ 347
METRIC RANK
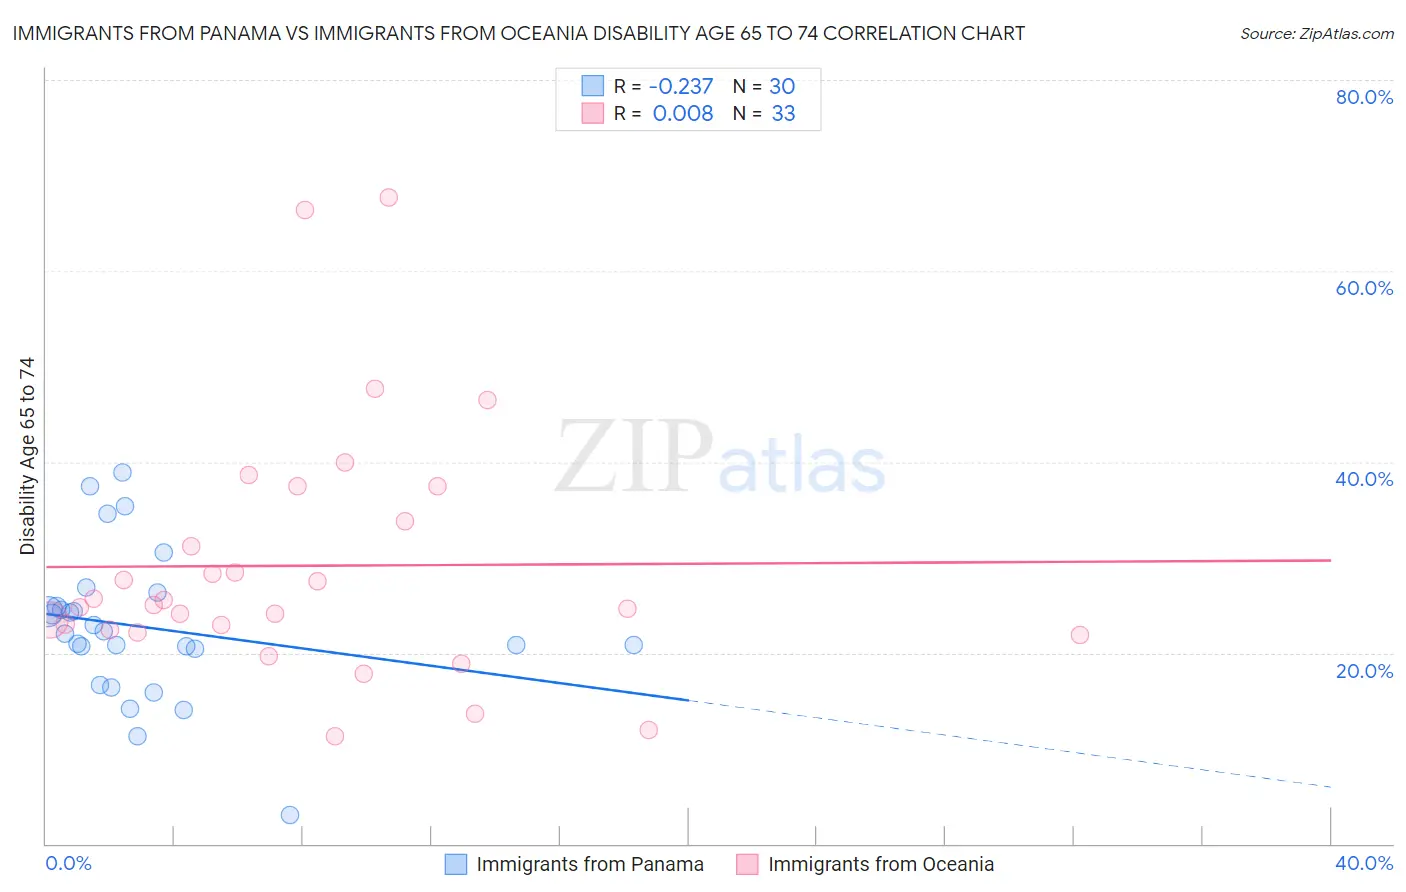
Immigrants from Panama vs Immigrants from Oceania Disability Age 65 to 74 Correlation Chart
The statistical analysis conducted on geographies consisting of 221,053,627 people shows a weak negative correlation between the proportion of Immigrants from Panama and percentage of population with a disability between the ages 65 and 75 in the United States with a correlation coefficient (R) of -0.237 and weighted average of 24.1%. Similarly, the statistical analysis conducted on geographies consisting of 304,918,832 people shows no correlation between the proportion of Immigrants from Oceania and percentage of population with a disability between the ages 65 and 75 in the United States with a correlation coefficient (R) of 0.008 and weighted average of 24.0%, a difference of 0.72%.
Disability Age 65 to 74 Correlation Summary
| Measurement | Immigrants from Panama | Immigrants from Oceania |
| Minimum | 3.0% | 11.3% |
| Maximum | 38.9% | 67.7% |
| Range | 35.9% | 56.4% |
| Mean | 22.7% | 29.1% |
| Median | 22.1% | 25.1% |
| Interquartile 25% (IQ1) | 20.4% | 22.2% |
| Interquartile 75% (IQ3) | 24.9% | 35.6% |
| Interquartile Range (IQR) | 4.4% | 13.3% |
| Standard Deviation (Sample) | 7.7% | 13.1% |
| Standard Deviation (Population) | 7.5% | 12.9% |
Demographics Similar to Immigrants from Panama and Immigrants from Oceania by Disability Age 65 to 74
In terms of disability age 65 to 74, the demographic groups most similar to Immigrants from Panama are Immigrants from Middle Africa (24.1%, a difference of 0.050%), Bermudan (24.2%, a difference of 0.090%), Iraqi (24.2%, a difference of 0.090%), Native Hawaiian (24.1%, a difference of 0.12%), and Nigerian (24.2%, a difference of 0.16%). Similarly, the demographic groups most similar to Immigrants from Oceania are Pennsylvania German (24.0%, a difference of 0.040%), Nicaraguan (23.9%, a difference of 0.080%), Jamaican (24.0%, a difference of 0.18%), French (23.9%, a difference of 0.24%), and Immigrants from Portugal (24.0%, a difference of 0.24%).
| Demographics | Rating | Rank | Disability Age 65 to 74 |
| Immigrants | Kenya | 19.6 /100 | #209 | Poor 23.8% |
| Trinidadians and Tobagonians | 16.4 /100 | #210 | Poor 23.9% |
| Immigrants | West Indies | 15.9 /100 | #211 | Poor 23.9% |
| French | 15.7 /100 | #212 | Poor 23.9% |
| Nicaraguans | 14.3 /100 | #213 | Poor 23.9% |
| Immigrants | Oceania | 13.6 /100 | #214 | Poor 24.0% |
| Pennsylvania Germans | 13.3 /100 | #215 | Poor 24.0% |
| Jamaicans | 12.2 /100 | #216 | Poor 24.0% |
| Immigrants | Portugal | 11.7 /100 | #217 | Poor 24.0% |
| Immigrants | Nigeria | 11.7 /100 | #218 | Poor 24.0% |
| Immigrants | Burma/Myanmar | 11.6 /100 | #219 | Poor 24.0% |
| Ghanaians | 10.4 /100 | #220 | Poor 24.1% |
| Immigrants | Nicaragua | 9.8 /100 | #221 | Tragic 24.1% |
| Native Hawaiians | 9.3 /100 | #222 | Tragic 24.1% |
| Immigrants | Middle Africa | 8.9 /100 | #223 | Tragic 24.1% |
| Immigrants | Panama | 8.6 /100 | #224 | Tragic 24.1% |
| Bermudans | 8.2 /100 | #225 | Tragic 24.2% |
| Iraqis | 8.1 /100 | #226 | Tragic 24.2% |
| Nigerians | 7.8 /100 | #227 | Tragic 24.2% |
| Whites/Caucasians | 6.6 /100 | #228 | Tragic 24.2% |
| Celtics | 6.4 /100 | #229 | Tragic 24.2% |