Immigrants from Northern Africa vs Moroccan Hearing Disability
COMPARE
Immigrants from Northern Africa
Moroccan
Hearing Disability
Hearing Disability Comparison
Immigrants from Northern Africa
Moroccans
2.8%
HEARING DISABILITY
96.9/ 100
METRIC RATING
85th/ 347
METRIC RANK
2.8%
HEARING DISABILITY
93.9/ 100
METRIC RATING
105th/ 347
METRIC RANK
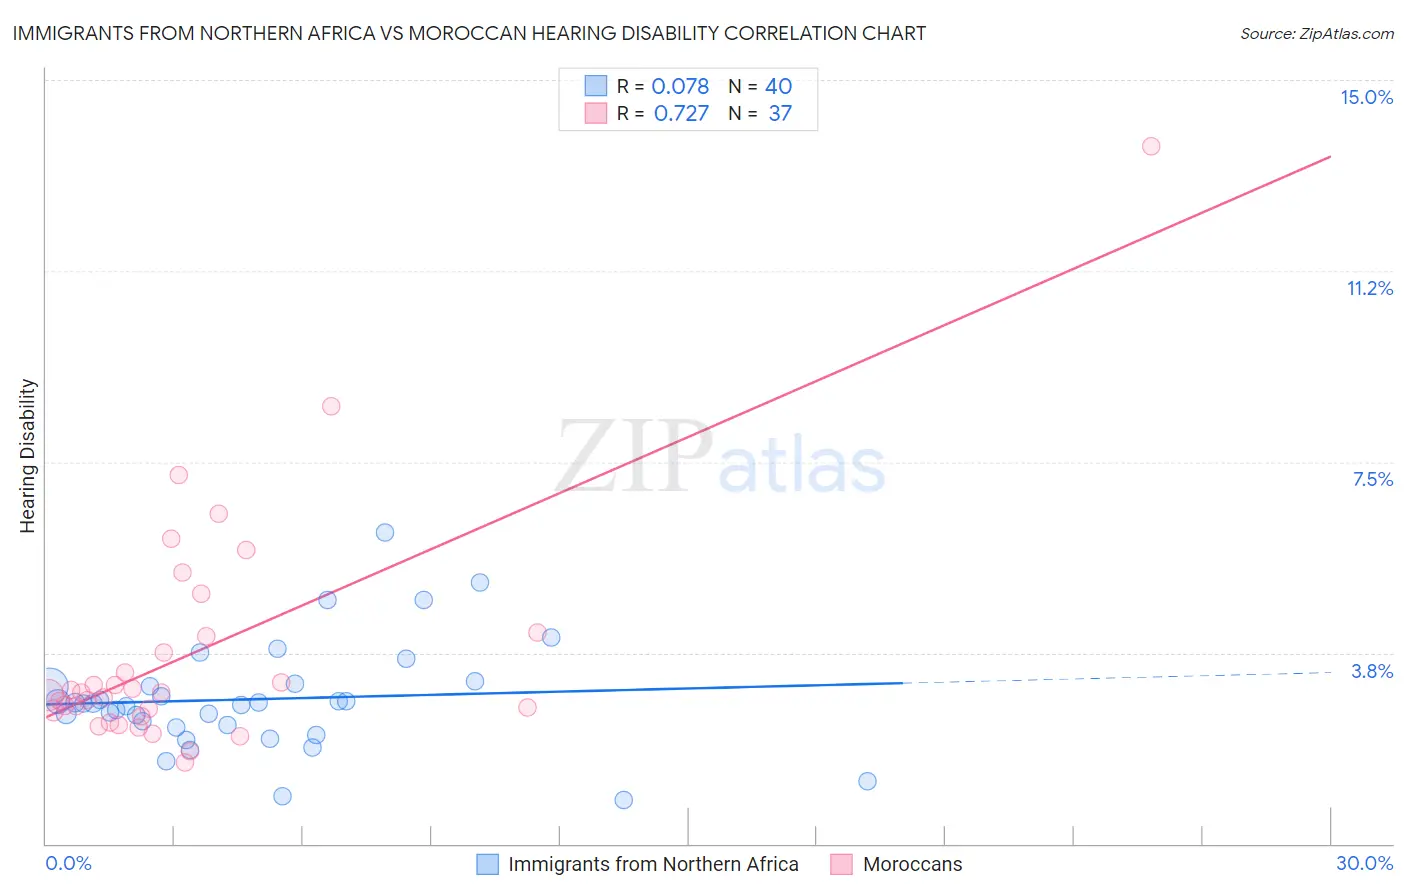
Immigrants from Northern Africa vs Moroccan Hearing Disability Correlation Chart
The statistical analysis conducted on geographies consisting of 321,108,850 people shows a slight positive correlation between the proportion of Immigrants from Northern Africa and percentage of population with hearing disability in the United States with a correlation coefficient (R) of 0.078 and weighted average of 2.8%. Similarly, the statistical analysis conducted on geographies consisting of 201,794,286 people shows a strong positive correlation between the proportion of Moroccans and percentage of population with hearing disability in the United States with a correlation coefficient (R) of 0.727 and weighted average of 2.8%, a difference of 1.8%.
Hearing Disability Correlation Summary
| Measurement | Immigrants from Northern Africa | Moroccan |
| Minimum | 0.86% | 1.6% |
| Maximum | 6.1% | 13.7% |
| Range | 5.3% | 12.1% |
| Mean | 2.8% | 3.8% |
| Median | 2.8% | 3.0% |
| Interquartile 25% (IQ1) | 2.3% | 2.6% |
| Interquartile 75% (IQ3) | 3.1% | 4.1% |
| Interquartile Range (IQR) | 0.81% | 1.5% |
| Standard Deviation (Sample) | 1.1% | 2.3% |
| Standard Deviation (Population) | 1.1% | 2.3% |
Demographics Similar to Immigrants from Northern Africa and Moroccans by Hearing Disability
In terms of hearing disability, the demographic groups most similar to Immigrants from Northern Africa are Immigrants from Iran (2.8%, a difference of 0.020%), Somali (2.8%, a difference of 0.13%), Immigrants from Turkey (2.8%, a difference of 0.17%), Belizean (2.8%, a difference of 0.20%), and Immigrants from Morocco (2.8%, a difference of 0.22%). Similarly, the demographic groups most similar to Moroccans are Burmese (2.8%, a difference of 0.11%), Immigrants from Indonesia (2.8%, a difference of 0.38%), Taiwanese (2.8%, a difference of 0.43%), Immigrants from Spain (2.8%, a difference of 0.44%), and Immigrants from Eastern Africa (2.8%, a difference of 0.49%).
| Demographics | Rating | Rank | Hearing Disability |
| Immigrants | Northern Africa | 96.9 /100 | #85 | Exceptional 2.8% |
| Immigrants | Iran | 96.8 /100 | #86 | Exceptional 2.8% |
| Somalis | 96.7 /100 | #87 | Exceptional 2.8% |
| Immigrants | Turkey | 96.7 /100 | #88 | Exceptional 2.8% |
| Belizeans | 96.6 /100 | #89 | Exceptional 2.8% |
| Immigrants | Morocco | 96.6 /100 | #90 | Exceptional 2.8% |
| Immigrants | Middle Africa | 96.5 /100 | #91 | Exceptional 2.8% |
| Iranians | 96.4 /100 | #92 | Exceptional 2.8% |
| Immigrants | Kuwait | 96.3 /100 | #93 | Exceptional 2.8% |
| Uruguayans | 95.9 /100 | #94 | Exceptional 2.8% |
| Israelis | 95.9 /100 | #95 | Exceptional 2.8% |
| Immigrants | Somalia | 95.5 /100 | #96 | Exceptional 2.8% |
| Immigrants | Afghanistan | 95.3 /100 | #97 | Exceptional 2.8% |
| Immigrants | Honduras | 95.1 /100 | #98 | Exceptional 2.8% |
| Immigrants | Guatemala | 95.1 /100 | #99 | Exceptional 2.8% |
| Immigrants | Eastern Africa | 95.0 /100 | #100 | Exceptional 2.8% |
| Immigrants | Spain | 94.9 /100 | #101 | Exceptional 2.8% |
| Taiwanese | 94.8 /100 | #102 | Exceptional 2.8% |
| Immigrants | Indonesia | 94.7 /100 | #103 | Exceptional 2.8% |
| Burmese | 94.2 /100 | #104 | Exceptional 2.8% |
| Moroccans | 93.9 /100 | #105 | Exceptional 2.8% |