Immigrants from Northern Africa vs Immigrants from Bangladesh Disability Age 18 to 34
COMPARE
Immigrants from Northern Africa
Immigrants from Bangladesh
Disability Age 18 to 34
Disability Age 18 to 34 Comparison
Immigrants from Northern Africa
Immigrants from Bangladesh
6.1%
DISABILITY AGE 18 TO 34
98.4/ 100
METRIC RATING
82nd/ 347
METRIC RANK
5.6%
DISABILITY AGE 18 TO 34
100.0/ 100
METRIC RATING
20th/ 347
METRIC RANK
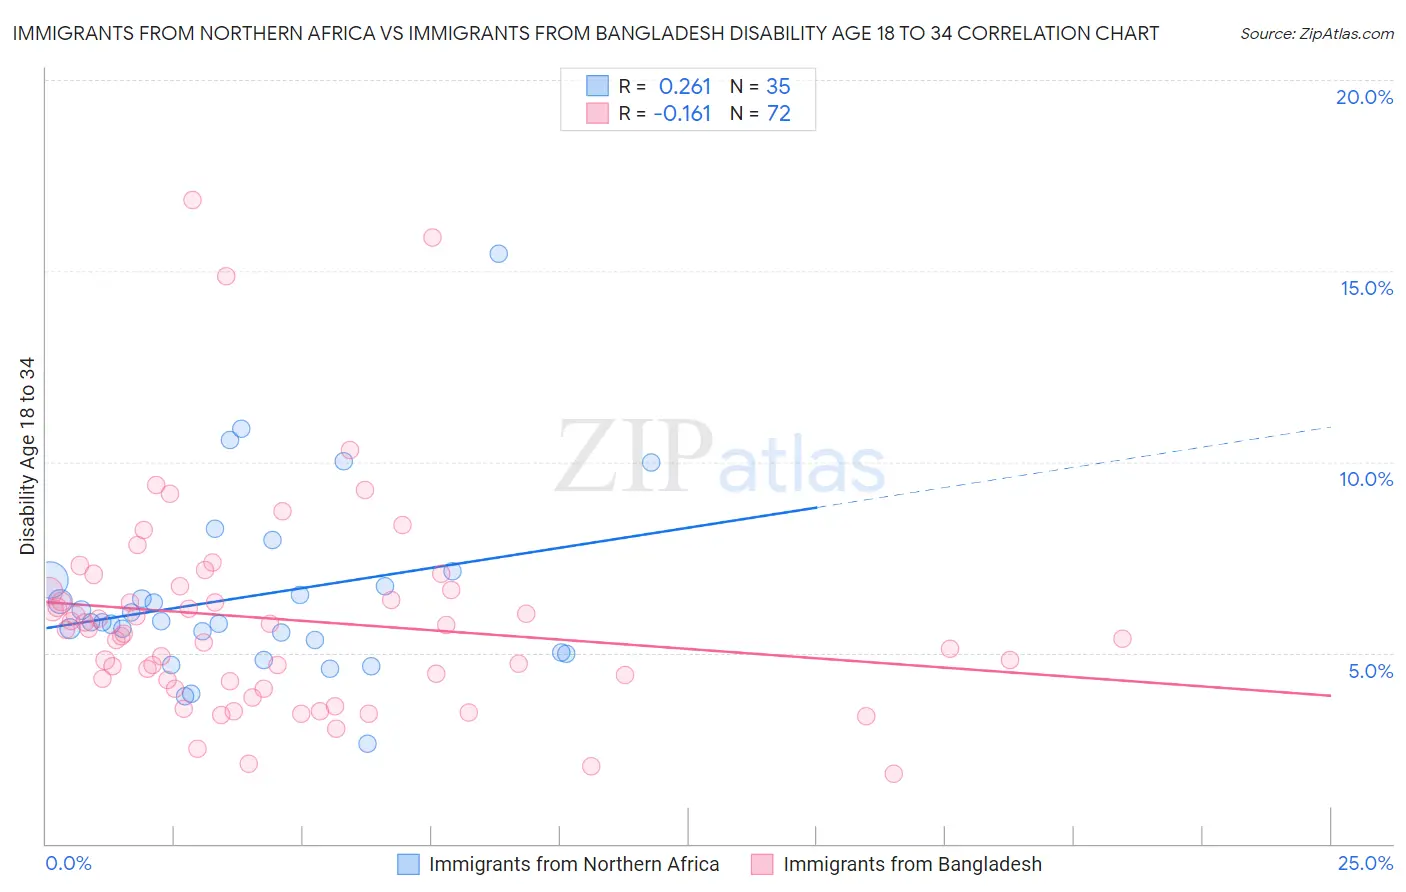
Immigrants from Northern Africa vs Immigrants from Bangladesh Disability Age 18 to 34 Correlation Chart
The statistical analysis conducted on geographies consisting of 320,800,058 people shows a weak positive correlation between the proportion of Immigrants from Northern Africa and percentage of population with a disability between the ages 18 and 35 in the United States with a correlation coefficient (R) of 0.261 and weighted average of 6.1%. Similarly, the statistical analysis conducted on geographies consisting of 203,579,264 people shows a poor negative correlation between the proportion of Immigrants from Bangladesh and percentage of population with a disability between the ages 18 and 35 in the United States with a correlation coefficient (R) of -0.161 and weighted average of 5.6%, a difference of 8.8%.
Disability Age 18 to 34 Correlation Summary
| Measurement | Immigrants from Northern Africa | Immigrants from Bangladesh |
| Minimum | 2.6% | 1.8% |
| Maximum | 15.5% | 16.9% |
| Range | 12.8% | 15.0% |
| Mean | 6.5% | 5.9% |
| Median | 5.8% | 5.5% |
| Interquartile 25% (IQ1) | 5.0% | 4.3% |
| Interquartile 75% (IQ3) | 6.9% | 6.6% |
| Interquartile Range (IQR) | 1.9% | 2.3% |
| Standard Deviation (Sample) | 2.4% | 2.8% |
| Standard Deviation (Population) | 2.4% | 2.8% |
Similar Demographics by Disability Age 18 to 34
Demographics Similar to Immigrants from Northern Africa by Disability Age 18 to 34
In terms of disability age 18 to 34, the demographic groups most similar to Immigrants from Northern Africa are Barbadian (6.1%, a difference of 0.060%), Israeli (6.1%, a difference of 0.10%), Immigrants from Ireland (6.1%, a difference of 0.17%), Immigrants from Australia (6.1%, a difference of 0.18%), and Immigrants from Chile (6.1%, a difference of 0.22%).
| Demographics | Rating | Rank | Disability Age 18 to 34 |
| Immigrants | Turkey | 99.1 /100 | #75 | Exceptional 6.1% |
| Immigrants | Western Asia | 98.9 /100 | #76 | Exceptional 6.1% |
| Immigrants | Russia | 98.9 /100 | #77 | Exceptional 6.1% |
| Assyrians/Chaldeans/Syriacs | 98.9 /100 | #78 | Exceptional 6.1% |
| Afghans | 98.7 /100 | #79 | Exceptional 6.1% |
| Immigrants | Chile | 98.5 /100 | #80 | Exceptional 6.1% |
| Immigrants | Australia | 98.5 /100 | #81 | Exceptional 6.1% |
| Immigrants | Northern Africa | 98.4 /100 | #82 | Exceptional 6.1% |
| Barbadians | 98.3 /100 | #83 | Exceptional 6.1% |
| Israelis | 98.3 /100 | #84 | Exceptional 6.1% |
| Immigrants | Ireland | 98.2 /100 | #85 | Exceptional 6.1% |
| Immigrants | Kuwait | 98.0 /100 | #86 | Exceptional 6.2% |
| Immigrants | Eastern Europe | 97.9 /100 | #87 | Exceptional 6.2% |
| Cambodians | 97.8 /100 | #88 | Exceptional 6.2% |
| Turks | 97.8 /100 | #89 | Exceptional 6.2% |
Demographics Similar to Immigrants from Bangladesh by Disability Age 18 to 34
In terms of disability age 18 to 34, the demographic groups most similar to Immigrants from Bangladesh are Thai (5.6%, a difference of 0.17%), Immigrants from Bolivia (5.6%, a difference of 0.24%), Immigrants from South Central Asia (5.7%, a difference of 0.58%), Immigrants from Nicaragua (5.7%, a difference of 0.65%), and Immigrants from Eastern Asia (5.6%, a difference of 1.0%).
| Demographics | Rating | Rank | Disability Age 18 to 34 |
| Immigrants | Iran | 100.0 /100 | #13 | Exceptional 5.5% |
| Indians (Asian) | 100.0 /100 | #14 | Exceptional 5.5% |
| Immigrants | India | 100.0 /100 | #15 | Exceptional 5.6% |
| Immigrants | Israel | 100.0 /100 | #16 | Exceptional 5.6% |
| Immigrants | Eastern Asia | 100.0 /100 | #17 | Exceptional 5.6% |
| Immigrants | Bolivia | 100.0 /100 | #18 | Exceptional 5.6% |
| Thais | 100.0 /100 | #19 | Exceptional 5.6% |
| Immigrants | Bangladesh | 100.0 /100 | #20 | Exceptional 5.6% |
| Immigrants | South Central Asia | 100.0 /100 | #21 | Exceptional 5.7% |
| Immigrants | Nicaragua | 100.0 /100 | #22 | Exceptional 5.7% |
| Cubans | 100.0 /100 | #23 | Exceptional 5.7% |
| Immigrants | Argentina | 100.0 /100 | #24 | Exceptional 5.7% |
| Immigrants | Singapore | 100.0 /100 | #25 | Exceptional 5.7% |
| Immigrants | Colombia | 100.0 /100 | #26 | Exceptional 5.7% |
| Immigrants | Venezuela | 99.9 /100 | #27 | Exceptional 5.7% |