Immigrants from Moldova vs Mexican Female Disability
COMPARE
Immigrants from Moldova
Mexican
Female Disability
Female Disability Comparison
Immigrants from Moldova
Mexicans
12.0%
FEMALE DISABILITY
81.4/ 100
METRIC RATING
150th/ 347
METRIC RANK
12.4%
FEMALE DISABILITY
15.7/ 100
METRIC RATING
209th/ 347
METRIC RANK
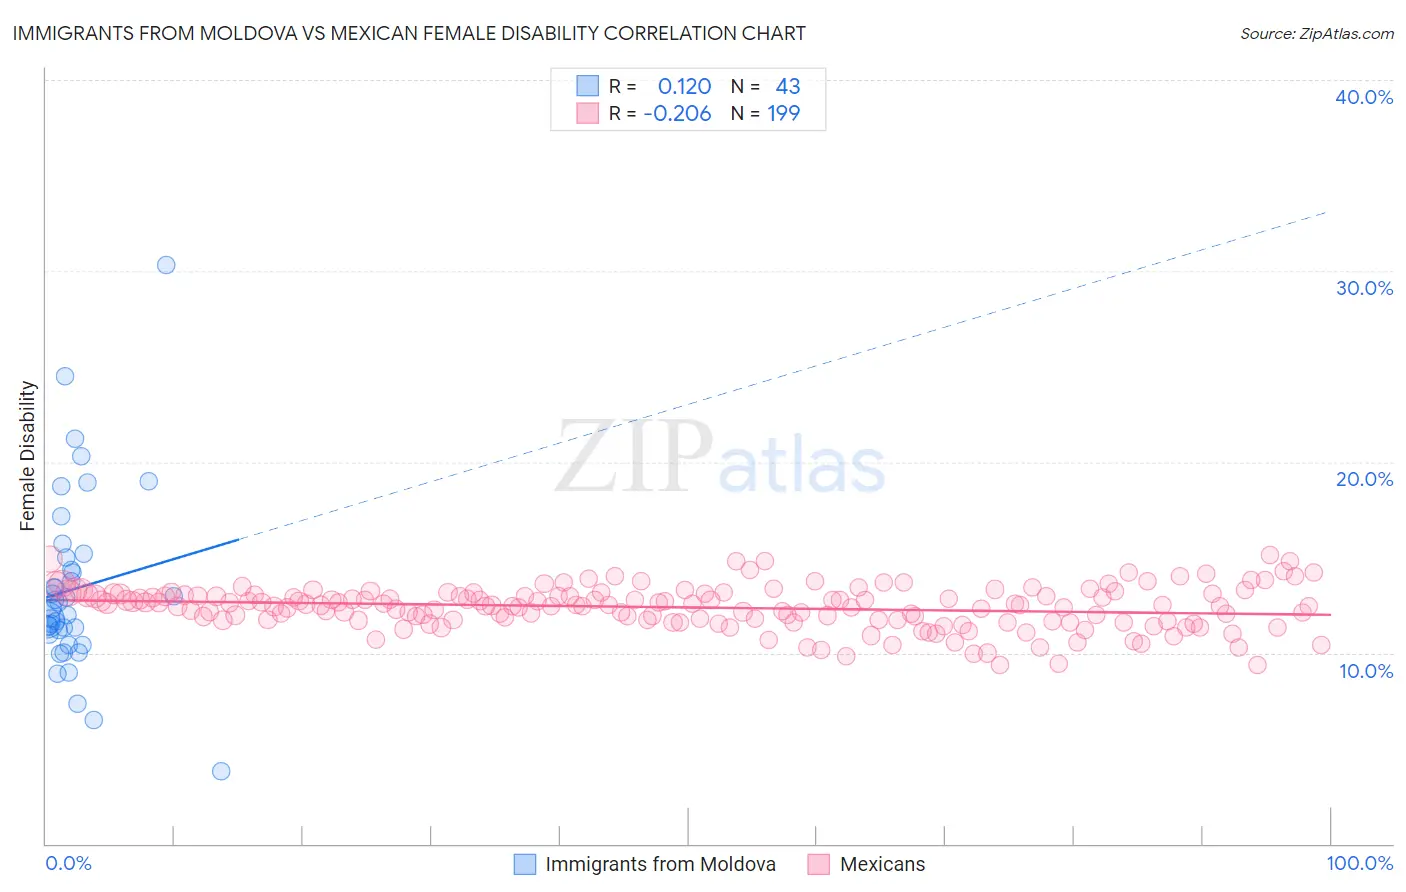
Immigrants from Moldova vs Mexican Female Disability Correlation Chart
The statistical analysis conducted on geographies consisting of 124,376,042 people shows a poor positive correlation between the proportion of Immigrants from Moldova and percentage of females with a disability in the United States with a correlation coefficient (R) of 0.120 and weighted average of 12.0%. Similarly, the statistical analysis conducted on geographies consisting of 564,937,802 people shows a weak negative correlation between the proportion of Mexicans and percentage of females with a disability in the United States with a correlation coefficient (R) of -0.206 and weighted average of 12.4%, a difference of 3.0%.
Female Disability Correlation Summary
| Measurement | Immigrants from Moldova | Mexican |
| Minimum | 3.8% | 9.3% |
| Maximum | 30.3% | 15.1% |
| Range | 26.5% | 5.8% |
| Mean | 13.4% | 12.4% |
| Median | 12.3% | 12.5% |
| Interquartile 25% (IQ1) | 11.0% | 11.7% |
| Interquartile 75% (IQ3) | 15.0% | 13.0% |
| Interquartile Range (IQR) | 4.0% | 1.3% |
| Standard Deviation (Sample) | 4.7% | 1.1% |
| Standard Deviation (Population) | 4.7% | 1.1% |
Similar Demographics by Female Disability
Demographics Similar to Immigrants from Moldova by Female Disability
In terms of female disability, the demographic groups most similar to Immigrants from Moldova are Greek (12.0%, a difference of 0.030%), Icelander (12.0%, a difference of 0.040%), Immigrants from Kenya (12.0%, a difference of 0.11%), Immigrants from Scotland (12.0%, a difference of 0.13%), and Sudanese (12.0%, a difference of 0.14%).
| Demographics | Rating | Rank | Female Disability |
| Immigrants | Sudan | 89.6 /100 | #143 | Excellent 11.9% |
| Immigrants | Austria | 87.9 /100 | #144 | Excellent 12.0% |
| Estonians | 87.8 /100 | #145 | Excellent 12.0% |
| Pakistanis | 84.6 /100 | #146 | Excellent 12.0% |
| Nigerians | 84.0 /100 | #147 | Excellent 12.0% |
| Immigrants | Kenya | 83.1 /100 | #148 | Excellent 12.0% |
| Greeks | 82.0 /100 | #149 | Excellent 12.0% |
| Immigrants | Moldova | 81.4 /100 | #150 | Excellent 12.0% |
| Icelanders | 80.7 /100 | #151 | Excellent 12.0% |
| Immigrants | Scotland | 79.3 /100 | #152 | Good 12.0% |
| Sudanese | 79.1 /100 | #153 | Good 12.0% |
| Syrians | 76.9 /100 | #154 | Good 12.1% |
| Ghanaians | 76.6 /100 | #155 | Good 12.1% |
| Moroccans | 72.9 /100 | #156 | Good 12.1% |
| Danes | 72.5 /100 | #157 | Good 12.1% |
Demographics Similar to Mexicans by Female Disability
In terms of female disability, the demographic groups most similar to Mexicans are Swiss (12.4%, a difference of 0.050%), Immigrants from Bosnia and Herzegovina (12.4%, a difference of 0.060%), Ute (12.4%, a difference of 0.070%), Immigrants from Thailand (12.4%, a difference of 0.090%), and Basque (12.4%, a difference of 0.12%).
| Demographics | Rating | Rank | Female Disability |
| Somalis | 21.5 /100 | #202 | Fair 12.3% |
| Immigrants | Barbados | 21.1 /100 | #203 | Fair 12.3% |
| Immigrants | Zaire | 20.9 /100 | #204 | Fair 12.3% |
| Immigrants | Grenada | 20.5 /100 | #205 | Fair 12.4% |
| Immigrants | Cuba | 20.2 /100 | #206 | Fair 12.4% |
| Croatians | 20.2 /100 | #207 | Fair 12.4% |
| Basques | 17.5 /100 | #208 | Poor 12.4% |
| Mexicans | 15.7 /100 | #209 | Poor 12.4% |
| Swiss | 14.9 /100 | #210 | Poor 12.4% |
| Immigrants | Bosnia and Herzegovina | 14.8 /100 | #211 | Poor 12.4% |
| Ute | 14.7 /100 | #212 | Poor 12.4% |
| Immigrants | Thailand | 14.5 /100 | #213 | Poor 12.4% |
| Panamanians | 13.5 /100 | #214 | Poor 12.4% |
| Samoans | 13.4 /100 | #215 | Poor 12.4% |
| Immigrants | Burma/Myanmar | 13.3 /100 | #216 | Poor 12.4% |