Immigrants from Liberia vs Osage Disability Age 18 to 34

COMPARE

Immigrants from Liberia
Race
Ancestry
AfghanAfricanAlaska NativeAlaskan AthabascanAlbanianAleutAlsatianAmericanApacheArabArapahoArgentineanArmenianAssyrian/Chaldean/SyriacAustralianAustrianBahamianBangladeshiBarbadianBasqueBelgianBelizeanBermudanBhutaneseBlackfeetBolivianBrazilianBritishBritish West IndianBulgarianBurmeseCajunCambodianCanadianCape VerdeanCarpatho RusynCelticCentral AmericanCentral American IndianCherokeeCheyenneChickasawChileanChineseChippewaChoctawColombianColvilleComancheCosta RicanCreeCreekCroatianCrowCubanCypriotCzechCzechoslovakianDanishDelawareDominicanDutchDutch West IndianEastern EuropeanEcuadorianEgyptianEnglishEstonianEthiopianEuropeanFijianFilipinoFinnishFrenchFrench American IndianFrench CanadianGermanGerman RussianGhanaianGreekGuamanian/ChamorroGuatemalanGuyaneseHaitianHmongHonduranHopiHoumaHungarianIcelanderIndian (Asian)IndonesianInupiatIranianIraqiIrishIroquoisIsraeliItalianJamaicanJapaneseJordanianKenyanKiowaKoreanLaotianLatvianLebaneseLiberianLithuanianLumbeeLuxembourgerMacedonianMalaysianMalteseMarshalleseMenomineeMexicanMexican American IndianMongolianMoroccanNative HawaiianNavajoNepaleseNew ZealanderNicaraguanNigerianNorthern EuropeanNorwegianOkinawanOttawaPaiutePakistaniPalestinianPanamanianParaguayanPennsylvania GermanPeruvianPimaPolishPortuguesePotawatomiPuebloPuerto RicanPuget Sound SalishRomanianRussianSalvadoranSamoanScandinavianScotch-IrishScottishSeminoleSenegaleseSerbianShoshoneSierra LeoneanSiouxSlavicSlovakSloveneSomaliSouth AfricanSouth AmericanSouth American IndianSoviet UnionSpaniardSpanishSpanish AmericanSpanish American IndianSri LankanSubsaharan AfricanSudaneseSwedishSwissSyrianTaiwaneseThaiTlingit-HaidaTohono O'OdhamTonganTrinidadian and TobagonianTsimshianTurkishU.S. Virgin IslanderUgandanUkrainianUruguayanUteVenezuelanVietnameseWelshWest IndianYakamaYaquiYugoslavianYumanYup'ikZimbabwean
Immigration
NonimmigrantsImmigrantsAfghanistanAfricaAlbaniaArgentinaArmeniaAsiaAustraliaAustriaBahamasBangladeshBarbadosBelarusBelgiumBelizeBoliviaBosnia and HerzegovinaBrazilBulgariaBurma/MyanmarCabo VerdeCambodiaCameroonCanadaCaribbeanCentral AmericaChileChinaColombiaCongoCosta RicaCroatiaCubaCzechoslovakiaDenmarkDominicaDominican RepublicEastern AfricaEastern AsiaEastern EuropeEcuadorEgyptEl SalvadorEnglandEritreaEthiopiaEuropeFijiFranceGermanyGhanaGreeceGrenadaGuatemalaGuyanaHaitiHondurasHong KongHungaryIndiaIndonesiaIranIraqIrelandIsraelItalyJamaicaJapanJordanKazakhstanKenyaKoreaKuwaitLaosLatin AmericaLatviaLebanonLiberiaLithuaniaMalaysiaMexicoMicronesiaMiddle AfricaMoldovaMoroccoNepalNetherlandsNicaraguaNigeriaNorth AmericaNorth MacedoniaNorthern AfricaNorthern EuropeNorwayOceaniaPakistanPanamaPeruPhilippinesPolandPortugalRomaniaRussiaSaudi ArabiaScotlandSenegalSerbiaSierra LeoneSingaporeSomaliaSouth AfricaSouth AmericaSouth Central AsiaSouth Eastern AsiaSouthern EuropeSpainSri LankaSt. Vincent and the GrenadinesSudanSwedenSwitzerlandSyriaTaiwanThailandTrinidad and TobagoTurkeyUgandaUkraineUruguayUzbekistanVenezuelaVietnamWest IndiesWestern AfricaWestern AsiaWestern EuropeYemenZaireZimbabweAzores
Osage
Race
Ancestry
AfghanAfricanAlaska NativeAlaskan AthabascanAlbanianAleutAlsatianAmericanApacheArabArapahoArgentineanArmenianAssyrian/Chaldean/SyriacAustralianAustrianBahamianBangladeshiBarbadianBasqueBelgianBelizeanBermudanBhutaneseBlackfeetBolivianBrazilianBritishBritish West IndianBulgarianBurmeseCajunCambodianCanadianCape VerdeanCarpatho RusynCelticCentral AmericanCentral American IndianCherokeeCheyenneChickasawChileanChineseChippewaChoctawColombianColvilleComancheCosta RicanCreeCreekCroatianCrowCubanCypriotCzechCzechoslovakianDanishDelawareDominicanDutchDutch West IndianEastern EuropeanEcuadorianEgyptianEnglishEstonianEthiopianEuropeanFijianFilipinoFinnishFrenchFrench American IndianFrench CanadianGermanGerman RussianGhanaianGreekGuamanian/ChamorroGuatemalanGuyaneseHaitianHmongHonduranHopiHoumaHungarianIcelanderIndian (Asian)IndonesianInupiatIranianIraqiIrishIroquoisIsraeliItalianJamaicanJapaneseJordanianKenyanKiowaKoreanLaotianLatvianLebaneseLiberianLithuanianLumbeeLuxembourgerMacedonianMalaysianMalteseMarshalleseMenomineeMexicanMexican American IndianMongolianMoroccanNative HawaiianNavajoNepaleseNew ZealanderNicaraguanNigerianNorthern EuropeanNorwegianOkinawanOsageOttawaPaiutePakistaniPalestinianPanamanianParaguayanPennsylvania GermanPeruvianPimaPolishPortuguesePotawatomiPuebloPuerto RicanPuget Sound SalishRomanianRussianSalvadoranSamoanScandinavianScotch-IrishScottishSeminoleSenegaleseSerbianShoshoneSierra LeoneanSiouxSlavicSlovakSloveneSomaliSouth AfricanSouth AmericanSouth American IndianSoviet UnionSpaniardSpanishSpanish AmericanSpanish American IndianSri LankanSubsaharan AfricanSudaneseSwedishSwissSyrianTaiwaneseThaiTlingit-HaidaTohono O'OdhamTonganTrinidadian and TobagonianTsimshianTurkishU.S. Virgin IslanderUgandanUkrainianUruguayanUteVenezuelanVietnameseWelshWest IndianYakamaYaquiYugoslavianYumanYup'ikZimbabwean
Immigration
NonimmigrantsImmigrantsAfghanistanAfricaAlbaniaArgentinaArmeniaAsiaAustraliaAustriaBahamasBangladeshBarbadosBelarusBelgiumBelizeBoliviaBosnia and HerzegovinaBrazilBulgariaBurma/MyanmarCabo VerdeCambodiaCameroonCanadaCaribbeanCentral AmericaChileChinaColombiaCongoCosta RicaCroatiaCubaCzechoslovakiaDenmarkDominicaDominican RepublicEastern AfricaEastern AsiaEastern EuropeEcuadorEgyptEl SalvadorEnglandEritreaEthiopiaEuropeFijiFranceGermanyGhanaGreeceGrenadaGuatemalaGuyanaHaitiHondurasHong KongHungaryIndiaIndonesiaIranIraqIrelandIsraelItalyJamaicaJapanJordanKazakhstanKenyaKoreaKuwaitLaosLatin AmericaLatviaLebanonLithuaniaMalaysiaMexicoMicronesiaMiddle AfricaMoldovaMoroccoNepalNetherlandsNicaraguaNigeriaNorth AmericaNorth MacedoniaNorthern AfricaNorthern EuropeNorwayOceaniaPakistanPanamaPeruPhilippinesPolandPortugalRomaniaRussiaSaudi ArabiaScotlandSenegalSerbiaSierra LeoneSingaporeSomaliaSouth AfricaSouth AmericaSouth Central AsiaSouth Eastern AsiaSouthern EuropeSpainSri LankaSt. Vincent and the GrenadinesSudanSwedenSwitzerlandSyriaTaiwanThailandTrinidad and TobagoTurkeyUgandaUkraineUruguayUzbekistanVenezuelaVietnamWest IndiesWestern AfricaWestern AsiaWestern EuropeYemenZaireZimbabweAzores
Disability Age 18 to 34
Income
Poverty
Unemployment
Labor Participation
Family Structure
Vehicle Availability
Education Level
Disability

Disability Age 18 to 34 Comparison

Immigrants from Liberia

Osage

Tragic
Tragic
7.1%
DISABILITY AGE 18 TO 34
0.8/ 100
METRIC RATING
246th/ 347
METRIC RANK
8.3%
DISABILITY AGE 18 TO 34
0.0/ 100
METRIC RATING
330th/ 347
METRIC RANK

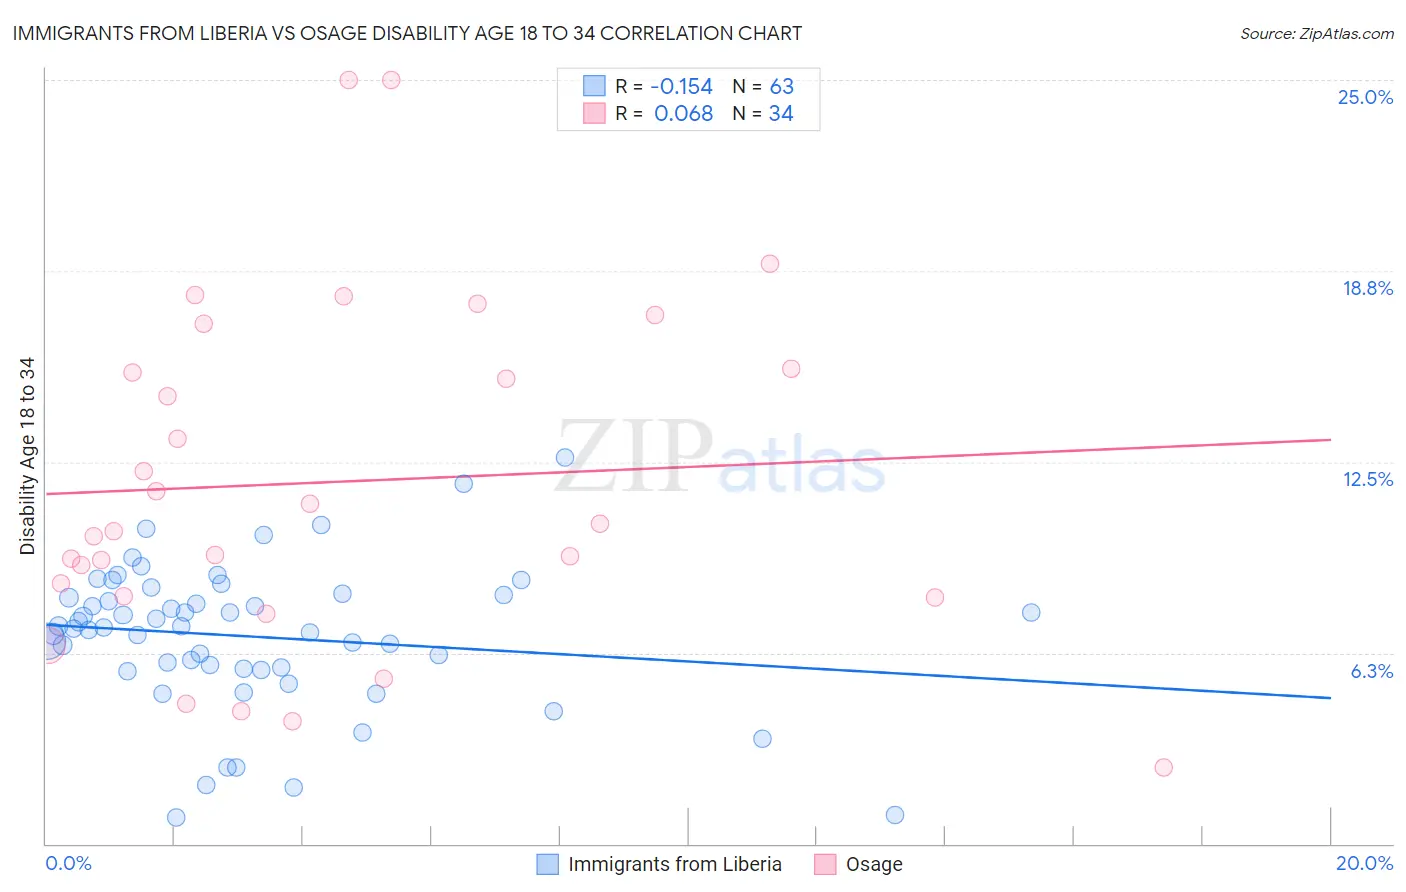
Immigrants from Liberia vs Osage Disability Age 18 to 34 Correlation Chart

The statistical analysis conducted on geographies consisting of 135,213,913 people shows a poor negative correlation between the proportion of Immigrants from Liberia and percentage of population with a disability between the ages 18 and 35 in the United States with a correlation coefficient (R) of -0.154 and weighted average of 7.1%. Similarly, the statistical analysis conducted on geographies consisting of 91,736,463 people shows a slight positive correlation between the proportion of Osage and percentage of population with a disability between the ages 18 and 35 in the United States with a correlation coefficient (R) of 0.068 and weighted average of 8.3%, a difference of 16.1%.
Immigrants from Liberia vs Osage Disability Age 18 to 34

Disability Age 18 to 34 Correlation Summary

MeasurementImmigrants from LiberiaOsage
Minimum0.85%2.5%
Maximum12.7%25.0%
Range11.8%22.5%
Mean6.8%11.8%
Median7.1%10.4%
Interquartile 25% (IQ1)5.7%8.1%
Interquartile 75% (IQ3)8.2%15.6%
Interquartile Range (IQR)2.4%7.4%
Standard Deviation (Sample)2.4%5.6%
Standard Deviation (Population)2.4%5.5%

Similar Demographics by Disability Age 18 to 34

Demographics Similar to Immigrants from Liberia by Disability Age 18 to 34

In terms of disability age 18 to 34, the demographic groups most similar to Immigrants from Liberia are Hungarian (7.1%, a difference of 0.020%), Immigrants from Zaire (7.1%, a difference of 0.12%), Yugoslavian (7.2%, a difference of 0.15%), Guamanian/Chamorro (7.2%, a difference of 0.18%), and Malaysian (7.2%, a difference of 0.28%).
DemographicsRating | RankDisability Age 18 to 34
Italians
1.2
/100
|
#239
Tragic
7.1%
Arapaho
1.1
/100
|
#240
Tragic
7.1%
Nepalese
1.1
/100
|
#241
Tragic
7.1%
Immigrants | Congo
1.1
/100
|
#242
Tragic
7.1%
Icelanders
1.0
/100
|
#243
Tragic
7.1%
Immigrants | Zaire
0.9
/100
|
#244
Tragic
7.1%
Hungarians
0.9
/100
|
#245
Tragic
7.1%
Immigrants | Liberia
0.8
/100
|
#246
Tragic
7.1%
Yugoslavians
0.8
/100
|
#247
Tragic
7.2%
Guamanians/Chamorros
0.8
/100
|
#248
Tragic
7.2%
Malaysians
0.7
/100
|
#249
Tragic
7.2%
Fijians
0.6
/100
|
#250
Tragic
7.2%
Spaniards
0.6
/100
|
#251
Tragic
7.2%
Poles
0.6
/100
|
#252
Tragic
7.2%
Croatians
0.5
/100
|
#253
Tragic
7.2%

Demographics Similar to Osage by Disability Age 18 to 34

In terms of disability age 18 to 34, the demographic groups most similar to Osage are Comanche (8.3%, a difference of 0.18%), Crow (8.3%, a difference of 0.25%), Puget Sound Salish (8.3%, a difference of 0.40%), Delaware (8.2%, a difference of 0.78%), and Sioux (8.2%, a difference of 0.82%).
DemographicsRating | RankDisability Age 18 to 34
French American Indians
0.0
/100
|
#323
Tragic
8.2%
Cajuns
0.0
/100
|
#324
Tragic
8.2%
Natives/Alaskans
0.0
/100
|
#325
Tragic
8.2%
Potawatomi
0.0
/100
|
#326
Tragic
8.2%
Sioux
0.0
/100
|
#327
Tragic
8.2%
Delaware
0.0
/100
|
#328
Tragic
8.2%
Crow
0.0
/100
|
#329
Tragic
8.3%
Osage
0.0
/100
|
#330
Tragic
8.3%
Comanche
0.0
/100
|
#331
Tragic
8.3%
Puget Sound Salish
0.0
/100
|
#332
Tragic
8.3%
Apache
0.0
/100
|
#333
Tragic
8.4%
Dutch West Indians
0.0
/100
|
#334
Tragic
8.4%
Seminole
0.0
/100
|
#335
Tragic
8.4%
Immigrants | Azores
0.0
/100
|
#336
Tragic
8.5%
Ottawa
0.0
/100
|
#337
Tragic
8.6%