Immigrants from Lebanon vs Indian (Asian) Disability Age 18 to 34

COMPARE

Immigrants from Lebanon
Race
Ancestry
AfghanAfricanAlaska NativeAlaskan AthabascanAlbanianAleutAlsatianAmericanApacheArabArapahoArgentineanArmenianAssyrian/Chaldean/SyriacAustralianAustrianBahamianBangladeshiBarbadianBasqueBelgianBelizeanBermudanBhutaneseBlackfeetBolivianBrazilianBritishBritish West IndianBulgarianBurmeseCajunCambodianCanadianCape VerdeanCarpatho RusynCelticCentral AmericanCentral American IndianCherokeeCheyenneChickasawChileanChineseChippewaChoctawColombianColvilleComancheCosta RicanCreeCreekCroatianCrowCubanCypriotCzechCzechoslovakianDanishDelawareDominicanDutchDutch West IndianEastern EuropeanEcuadorianEgyptianEnglishEstonianEthiopianEuropeanFijianFilipinoFinnishFrenchFrench American IndianFrench CanadianGermanGerman RussianGhanaianGreekGuamanian/ChamorroGuatemalanGuyaneseHaitianHmongHonduranHopiHoumaHungarianIcelanderIndonesianInupiatIranianIraqiIrishIroquoisIsraeliItalianJamaicanJapaneseJordanianKenyanKiowaKoreanLaotianLatvianLebaneseLiberianLithuanianLumbeeLuxembourgerMacedonianMalaysianMalteseMarshalleseMenomineeMexicanMexican American IndianMongolianMoroccanNative HawaiianNavajoNepaleseNew ZealanderNicaraguanNigerianNorthern EuropeanNorwegianOkinawanOsageOttawaPaiutePakistaniPalestinianPanamanianParaguayanPennsylvania GermanPeruvianPimaPolishPortuguesePotawatomiPuebloPuerto RicanPuget Sound SalishRomanianRussianSalvadoranSamoanScandinavianScotch-IrishScottishSeminoleSenegaleseSerbianShoshoneSierra LeoneanSiouxSlavicSlovakSloveneSomaliSouth AfricanSouth AmericanSouth American IndianSoviet UnionSpaniardSpanishSpanish AmericanSpanish American IndianSri LankanSubsaharan AfricanSudaneseSwedishSwissSyrianTaiwaneseThaiTlingit-HaidaTohono O'OdhamTonganTrinidadian and TobagonianTsimshianTurkishU.S. Virgin IslanderUgandanUkrainianUruguayanUteVenezuelanVietnameseWelshWest IndianYakamaYaquiYugoslavianYumanYup'ikZimbabwean
Immigration
NonimmigrantsImmigrantsAfghanistanAfricaAlbaniaArgentinaArmeniaAsiaAustraliaAustriaBahamasBangladeshBarbadosBelarusBelgiumBelizeBoliviaBosnia and HerzegovinaBrazilBulgariaBurma/MyanmarCabo VerdeCambodiaCameroonCanadaCaribbeanCentral AmericaChileChinaColombiaCongoCosta RicaCroatiaCubaCzechoslovakiaDenmarkDominicaDominican RepublicEastern AfricaEastern AsiaEastern EuropeEcuadorEgyptEl SalvadorEnglandEritreaEthiopiaEuropeFijiFranceGermanyGhanaGreeceGrenadaGuatemalaGuyanaHaitiHondurasHong KongHungaryIndiaIndonesiaIranIraqIrelandIsraelItalyJamaicaJapanJordanKazakhstanKenyaKoreaKuwaitLaosLatin AmericaLatviaLebanonLiberiaLithuaniaMalaysiaMexicoMicronesiaMiddle AfricaMoldovaMoroccoNepalNetherlandsNicaraguaNigeriaNorth AmericaNorth MacedoniaNorthern AfricaNorthern EuropeNorwayOceaniaPakistanPanamaPeruPhilippinesPolandPortugalRomaniaRussiaSaudi ArabiaScotlandSenegalSerbiaSierra LeoneSingaporeSomaliaSouth AfricaSouth AmericaSouth Central AsiaSouth Eastern AsiaSouthern EuropeSpainSri LankaSt. Vincent and the GrenadinesSudanSwedenSwitzerlandSyriaTaiwanThailandTrinidad and TobagoTurkeyUgandaUkraineUruguayUzbekistanVenezuelaVietnamWest IndiesWestern AfricaWestern AsiaWestern EuropeYemenZaireZimbabweAzores
Indian (Asian)
Race
Ancestry
AfghanAfricanAlaska NativeAlaskan AthabascanAlbanianAleutAlsatianAmericanApacheArabArapahoArgentineanArmenianAssyrian/Chaldean/SyriacAustralianAustrianBahamianBangladeshiBarbadianBasqueBelgianBelizeanBermudanBhutaneseBlackfeetBolivianBrazilianBritishBritish West IndianBulgarianBurmeseCajunCambodianCanadianCape VerdeanCarpatho RusynCelticCentral AmericanCentral American IndianCherokeeCheyenneChickasawChileanChineseChippewaChoctawColombianColvilleComancheCosta RicanCreeCreekCroatianCrowCubanCypriotCzechCzechoslovakianDanishDelawareDominicanDutchDutch West IndianEastern EuropeanEcuadorianEgyptianEnglishEstonianEthiopianEuropeanFijianFilipinoFinnishFrenchFrench American IndianFrench CanadianGermanGerman RussianGhanaianGreekGuamanian/ChamorroGuatemalanGuyaneseHaitianHmongHonduranHopiHoumaHungarianIcelanderIndian (Asian)IndonesianInupiatIranianIraqiIrishIroquoisIsraeliItalianJamaicanJapaneseJordanianKenyanKiowaKoreanLaotianLatvianLebaneseLiberianLithuanianLumbeeLuxembourgerMacedonianMalaysianMalteseMarshalleseMenomineeMexicanMexican American IndianMongolianMoroccanNative HawaiianNavajoNepaleseNew ZealanderNicaraguanNigerianNorthern EuropeanNorwegianOkinawanOsageOttawaPaiutePakistaniPalestinianPanamanianParaguayanPennsylvania GermanPeruvianPimaPolishPortuguesePotawatomiPuebloPuerto RicanPuget Sound SalishRomanianRussianSalvadoranSamoanScandinavianScotch-IrishScottishSeminoleSenegaleseSerbianShoshoneSierra LeoneanSiouxSlavicSlovakSloveneSomaliSouth AfricanSouth AmericanSouth American IndianSoviet UnionSpaniardSpanishSpanish AmericanSpanish American IndianSri LankanSubsaharan AfricanSudaneseSwedishSwissSyrianTaiwaneseThaiTlingit-HaidaTohono O'OdhamTonganTrinidadian and TobagonianTsimshianTurkishU.S. Virgin IslanderUgandanUkrainianUruguayanUteVenezuelanVietnameseWelshWest IndianYakamaYaquiYugoslavianYumanYup'ikZimbabwean
Immigration
NonimmigrantsImmigrantsAfghanistanAfricaAlbaniaArgentinaArmeniaAsiaAustraliaAustriaBahamasBangladeshBarbadosBelarusBelgiumBelizeBoliviaBosnia and HerzegovinaBrazilBulgariaBurma/MyanmarCabo VerdeCambodiaCameroonCanadaCaribbeanCentral AmericaChileChinaColombiaCongoCosta RicaCroatiaCubaCzechoslovakiaDenmarkDominicaDominican RepublicEastern AfricaEastern AsiaEastern EuropeEcuadorEgyptEl SalvadorEnglandEritreaEthiopiaEuropeFijiFranceGermanyGhanaGreeceGrenadaGuatemalaGuyanaHaitiHondurasHong KongHungaryIndiaIndonesiaIranIraqIrelandIsraelItalyJamaicaJapanJordanKazakhstanKenyaKoreaKuwaitLaosLatin AmericaLatviaLiberiaLithuaniaMalaysiaMexicoMicronesiaMiddle AfricaMoldovaMoroccoNepalNetherlandsNicaraguaNigeriaNorth AmericaNorth MacedoniaNorthern AfricaNorthern EuropeNorwayOceaniaPakistanPanamaPeruPhilippinesPolandPortugalRomaniaRussiaSaudi ArabiaScotlandSenegalSerbiaSierra LeoneSingaporeSomaliaSouth AfricaSouth AmericaSouth Central AsiaSouth Eastern AsiaSouthern EuropeSpainSri LankaSt. Vincent and the GrenadinesSudanSwedenSwitzerlandSyriaTaiwanThailandTrinidad and TobagoTurkeyUgandaUkraineUruguayUzbekistanVenezuelaVietnamWest IndiesWestern AfricaWestern AsiaWestern EuropeYemenZaireZimbabweAzores
Disability Age 18 to 34
Income
Poverty
Unemployment
Labor Participation
Family Structure
Vehicle Availability
Education Level
Disability

Disability Age 18 to 34 Comparison

Immigrants from Lebanon

Indians (Asian)

Exceptional
Exceptional
6.0%
DISABILITY AGE 18 TO 34
99.2/ 100
METRIC RATING
72nd/ 347
METRIC RANK
5.5%
DISABILITY AGE 18 TO 34
100.0/ 100
METRIC RATING
14th/ 347
METRIC RANK

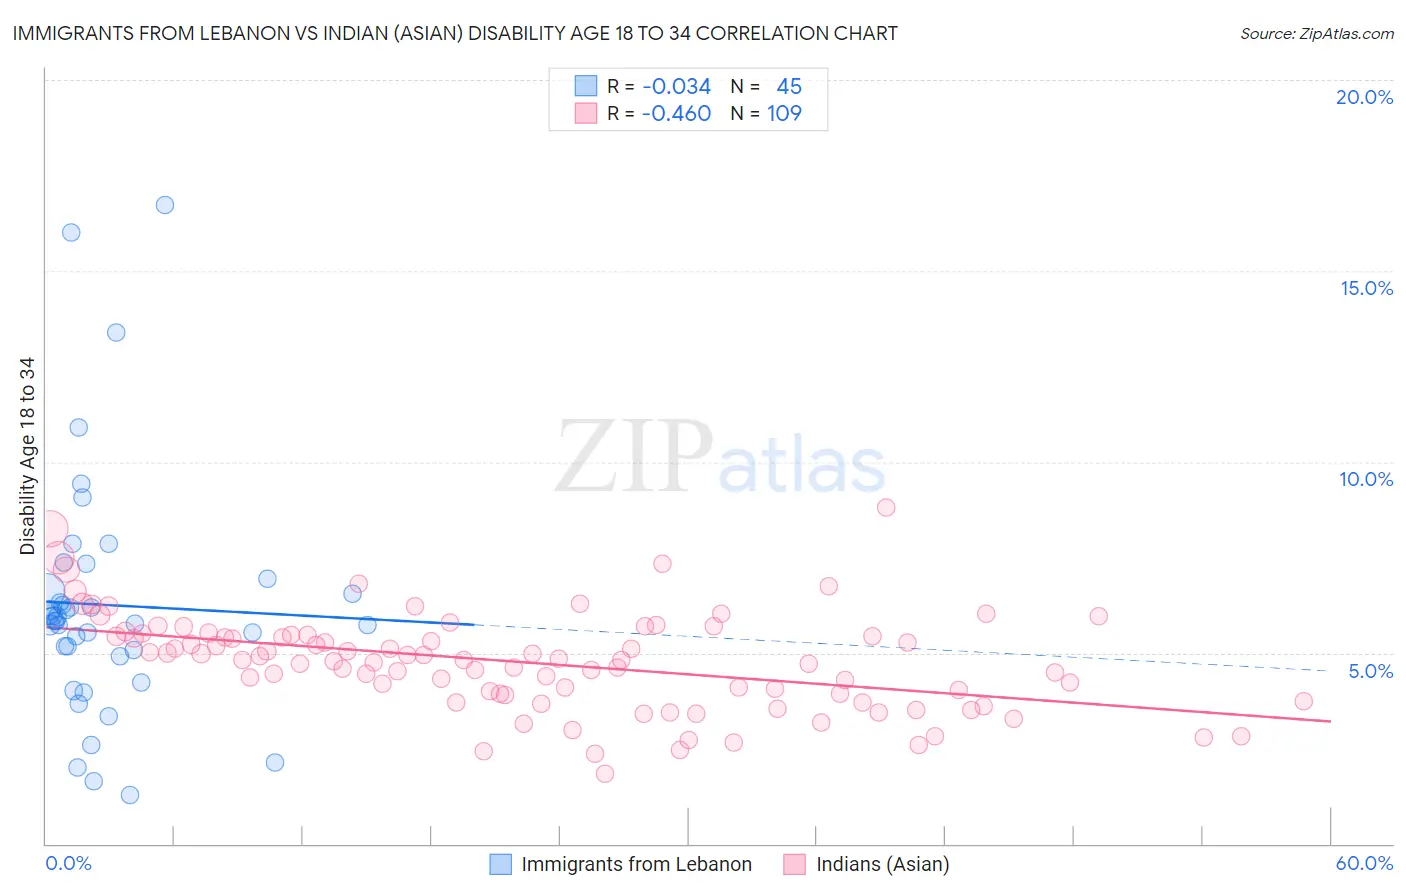
Immigrants from Lebanon vs Indian (Asian) Disability Age 18 to 34 Correlation Chart

The statistical analysis conducted on geographies consisting of 216,986,941 people shows no correlation between the proportion of Immigrants from Lebanon and percentage of population with a disability between the ages 18 and 35 in the United States with a correlation coefficient (R) of -0.034 and weighted average of 6.0%. Similarly, the statistical analysis conducted on geographies consisting of 493,463,376 people shows a moderate negative correlation between the proportion of Indians (Asian) and percentage of population with a disability between the ages 18 and 35 in the United States with a correlation coefficient (R) of -0.460 and weighted average of 5.5%, a difference of 8.9%.
Immigrants from Lebanon vs Indian (Asian) Disability Age 18 to 34

Disability Age 18 to 34 Correlation Summary

MeasurementImmigrants from LebanonIndian (Asian)
Minimum1.3%1.8%
Maximum16.7%8.8%
Range15.5%7.0%
Mean6.3%4.8%
Median5.8%4.8%
Interquartile 25% (IQ1)5.0%3.9%
Interquartile 75% (IQ3)6.8%5.5%
Interquartile Range (IQR)1.8%1.6%
Standard Deviation (Sample)3.1%1.3%
Standard Deviation (Population)3.1%1.3%

Similar Demographics by Disability Age 18 to 34

Demographics Similar to Immigrants from Lebanon by Disability Age 18 to 34

In terms of disability age 18 to 34, the demographic groups most similar to Immigrants from Lebanon are Cypriot (6.0%, a difference of 0.0%), Haitian (6.0%, a difference of 0.090%), Immigrants from Japan (6.0%, a difference of 0.12%), Immigrants from Turkey (6.1%, a difference of 0.38%), and Immigrants from Greece (6.0%, a difference of 0.39%).
DemographicsRating | RankDisability Age 18 to 34
Trinidadians and Tobagonians
99.5
/100
|
#65
Exceptional
6.0%
Burmese
99.5
/100
|
#66
Exceptional
6.0%
Immigrants | North Macedonia
99.5
/100
|
#67
Exceptional
6.0%
Immigrants | Poland
99.5
/100
|
#68
Exceptional
6.0%
Immigrants | West Indies
99.4
/100
|
#69
Exceptional
6.0%
Immigrants | Greece
99.4
/100
|
#70
Exceptional
6.0%
Immigrants | Japan
99.3
/100
|
#71
Exceptional
6.0%
Immigrants | Lebanon
99.2
/100
|
#72
Exceptional
6.0%
Cypriots
99.2
/100
|
#73
Exceptional
6.0%
Haitians
99.2
/100
|
#74
Exceptional
6.0%
Immigrants | Turkey
99.1
/100
|
#75
Exceptional
6.1%
Immigrants | Western Asia
98.9
/100
|
#76
Exceptional
6.1%
Immigrants | Russia
98.9
/100
|
#77
Exceptional
6.1%
Assyrians/Chaldeans/Syriacs
98.9
/100
|
#78
Exceptional
6.1%
Afghans
98.7
/100
|
#79
Exceptional
6.1%

Demographics Similar to Indians (Asian) by Disability Age 18 to 34

In terms of disability age 18 to 34, the demographic groups most similar to Indians (Asian) are Immigrants from Iran (5.5%, a difference of 0.15%), Immigrants from India (5.6%, a difference of 0.38%), Immigrants from Israel (5.6%, a difference of 0.41%), Immigrants from St. Vincent and the Grenadines (5.5%, a difference of 0.47%), and Vietnamese (5.5%, a difference of 0.53%).
DemographicsRating | RankDisability Age 18 to 34
Immigrants | China
100.0
/100
|
#7
Exceptional
5.4%
Immigrants | Guyana
100.0
/100
|
#8
Exceptional
5.5%
Guyanese
100.0
/100
|
#9
Exceptional
5.5%
Immigrants | Uzbekistan
100.0
/100
|
#10
Exceptional
5.5%
Vietnamese
100.0
/100
|
#11
Exceptional
5.5%
Immigrants | St. Vincent and the Grenadines
100.0
/100
|
#12
Exceptional
5.5%
Immigrants | Iran
100.0
/100
|
#13
Exceptional
5.5%
Indians (Asian)
100.0
/100
|
#14
Exceptional
5.5%
Immigrants | India
100.0
/100
|
#15
Exceptional
5.6%
Immigrants | Israel
100.0
/100
|
#16
Exceptional
5.6%
Immigrants | Eastern Asia
100.0
/100
|
#17
Exceptional
5.6%
Immigrants | Bolivia
100.0
/100
|
#18
Exceptional
5.6%
Thais
100.0
/100
|
#19
Exceptional
5.6%
Immigrants | Bangladesh
100.0
/100
|
#20
Exceptional
5.6%
Immigrants | South Central Asia
100.0
/100
|
#21
Exceptional
5.7%