Immigrants from Lebanon vs Immigrants from Korea Disability Age 35 to 64

COMPARE

Immigrants from Lebanon
Race
Ancestry
AfghanAfricanAlaska NativeAlaskan AthabascanAlbanianAleutAlsatianAmericanApacheArabArapahoArgentineanArmenianAssyrian/Chaldean/SyriacAustralianAustrianBahamianBangladeshiBarbadianBasqueBelgianBelizeanBermudanBhutaneseBlackfeetBolivianBrazilianBritishBritish West IndianBulgarianBurmeseCajunCambodianCanadianCape VerdeanCarpatho RusynCelticCentral AmericanCentral American IndianCherokeeCheyenneChickasawChileanChineseChippewaChoctawColombianColvilleComancheCosta RicanCreeCreekCroatianCrowCubanCypriotCzechCzechoslovakianDanishDelawareDominicanDutchDutch West IndianEastern EuropeanEcuadorianEgyptianEnglishEstonianEthiopianEuropeanFijianFilipinoFinnishFrenchFrench American IndianFrench CanadianGermanGerman RussianGhanaianGreekGuamanian/ChamorroGuatemalanGuyaneseHaitianHmongHonduranHopiHoumaHungarianIcelanderIndian (Asian)IndonesianInupiatIranianIraqiIrishIroquoisIsraeliItalianJamaicanJapaneseJordanianKenyanKiowaKoreanLaotianLatvianLebaneseLiberianLithuanianLumbeeLuxembourgerMacedonianMalaysianMalteseMarshalleseMenomineeMexicanMexican American IndianMongolianMoroccanNative HawaiianNavajoNepaleseNew ZealanderNicaraguanNigerianNorthern EuropeanNorwegianOkinawanOsageOttawaPaiutePakistaniPalestinianPanamanianParaguayanPennsylvania GermanPeruvianPimaPolishPortuguesePotawatomiPuebloPuerto RicanPuget Sound SalishRomanianRussianSalvadoranSamoanScandinavianScotch-IrishScottishSeminoleSenegaleseSerbianShoshoneSierra LeoneanSiouxSlavicSlovakSloveneSomaliSouth AfricanSouth AmericanSouth American IndianSoviet UnionSpaniardSpanishSpanish AmericanSpanish American IndianSri LankanSubsaharan AfricanSudaneseSwedishSwissSyrianTaiwaneseThaiTlingit-HaidaTohono O'OdhamTonganTrinidadian and TobagonianTsimshianTurkishU.S. Virgin IslanderUgandanUkrainianUruguayanUteVenezuelanVietnameseWelshWest IndianYakamaYaquiYugoslavianYumanYup'ikZimbabwean
Immigration
NonimmigrantsImmigrantsAfghanistanAfricaAlbaniaArgentinaArmeniaAsiaAustraliaAustriaBahamasBangladeshBarbadosBelarusBelgiumBelizeBoliviaBosnia and HerzegovinaBrazilBulgariaBurma/MyanmarCabo VerdeCambodiaCameroonCanadaCaribbeanCentral AmericaChileChinaColombiaCongoCosta RicaCroatiaCubaCzechoslovakiaDenmarkDominicaDominican RepublicEastern AfricaEastern AsiaEastern EuropeEcuadorEgyptEl SalvadorEnglandEritreaEthiopiaEuropeFijiFranceGermanyGhanaGreeceGrenadaGuatemalaGuyanaHaitiHondurasHong KongHungaryIndiaIndonesiaIranIraqIrelandIsraelItalyJamaicaJapanJordanKazakhstanKenyaKuwaitLaosLatin AmericaLatviaLebanonLiberiaLithuaniaMalaysiaMexicoMicronesiaMiddle AfricaMoldovaMoroccoNepalNetherlandsNicaraguaNigeriaNorth AmericaNorth MacedoniaNorthern AfricaNorthern EuropeNorwayOceaniaPakistanPanamaPeruPhilippinesPolandPortugalRomaniaRussiaSaudi ArabiaScotlandSenegalSerbiaSierra LeoneSingaporeSomaliaSouth AfricaSouth AmericaSouth Central AsiaSouth Eastern AsiaSouthern EuropeSpainSri LankaSt. Vincent and the GrenadinesSudanSwedenSwitzerlandSyriaTaiwanThailandTrinidad and TobagoTurkeyUgandaUkraineUruguayUzbekistanVenezuelaVietnamWest IndiesWestern AfricaWestern AsiaWestern EuropeYemenZaireZimbabweAzores
Immigrants from Korea
Race
Ancestry
AfghanAfricanAlaska NativeAlaskan AthabascanAlbanianAleutAlsatianAmericanApacheArabArapahoArgentineanArmenianAssyrian/Chaldean/SyriacAustralianAustrianBahamianBangladeshiBarbadianBasqueBelgianBelizeanBermudanBhutaneseBlackfeetBolivianBrazilianBritishBritish West IndianBulgarianBurmeseCajunCambodianCanadianCape VerdeanCarpatho RusynCelticCentral AmericanCentral American IndianCherokeeCheyenneChickasawChileanChineseChippewaChoctawColombianColvilleComancheCosta RicanCreeCreekCroatianCrowCubanCypriotCzechCzechoslovakianDanishDelawareDominicanDutchDutch West IndianEastern EuropeanEcuadorianEgyptianEnglishEstonianEthiopianEuropeanFijianFilipinoFinnishFrenchFrench American IndianFrench CanadianGermanGerman RussianGhanaianGreekGuamanian/ChamorroGuatemalanGuyaneseHaitianHmongHonduranHopiHoumaHungarianIcelanderIndian (Asian)IndonesianInupiatIranianIraqiIrishIroquoisIsraeliItalianJamaicanJapaneseJordanianKenyanKiowaKoreanLaotianLatvianLebaneseLiberianLithuanianLumbeeLuxembourgerMacedonianMalaysianMalteseMarshalleseMenomineeMexicanMexican American IndianMongolianMoroccanNative HawaiianNavajoNepaleseNew ZealanderNicaraguanNigerianNorthern EuropeanNorwegianOkinawanOsageOttawaPaiutePakistaniPalestinianPanamanianParaguayanPennsylvania GermanPeruvianPimaPolishPortuguesePotawatomiPuebloPuerto RicanPuget Sound SalishRomanianRussianSalvadoranSamoanScandinavianScotch-IrishScottishSeminoleSenegaleseSerbianShoshoneSierra LeoneanSiouxSlavicSlovakSloveneSomaliSouth AfricanSouth AmericanSouth American IndianSoviet UnionSpaniardSpanishSpanish AmericanSpanish American IndianSri LankanSubsaharan AfricanSudaneseSwedishSwissSyrianTaiwaneseThaiTlingit-HaidaTohono O'OdhamTonganTrinidadian and TobagonianTsimshianTurkishU.S. Virgin IslanderUgandanUkrainianUruguayanUteVenezuelanVietnameseWelshWest IndianYakamaYaquiYugoslavianYumanYup'ikZimbabwean
Immigration
NonimmigrantsImmigrantsAfghanistanAfricaAlbaniaArgentinaArmeniaAsiaAustraliaAustriaBahamasBangladeshBarbadosBelarusBelgiumBelizeBoliviaBosnia and HerzegovinaBrazilBulgariaBurma/MyanmarCabo VerdeCambodiaCameroonCanadaCaribbeanCentral AmericaChileChinaColombiaCongoCosta RicaCroatiaCubaCzechoslovakiaDenmarkDominicaDominican RepublicEastern AfricaEastern AsiaEastern EuropeEcuadorEgyptEl SalvadorEnglandEritreaEthiopiaEuropeFijiFranceGermanyGhanaGreeceGrenadaGuatemalaGuyanaHaitiHondurasHong KongHungaryIndiaIndonesiaIranIraqIrelandIsraelItalyJamaicaJapanJordanKazakhstanKenyaKoreaKuwaitLaosLatin AmericaLatviaLiberiaLithuaniaMalaysiaMexicoMicronesiaMiddle AfricaMoldovaMoroccoNepalNetherlandsNicaraguaNigeriaNorth AmericaNorth MacedoniaNorthern AfricaNorthern EuropeNorwayOceaniaPakistanPanamaPeruPhilippinesPolandPortugalRomaniaRussiaSaudi ArabiaScotlandSenegalSerbiaSierra LeoneSingaporeSomaliaSouth AfricaSouth AmericaSouth Central AsiaSouth Eastern AsiaSouthern EuropeSpainSri LankaSt. Vincent and the GrenadinesSudanSwedenSwitzerlandSyriaTaiwanThailandTrinidad and TobagoTurkeyUgandaUkraineUruguayUzbekistanVenezuelaVietnamWest IndiesWestern AfricaWestern AsiaWestern EuropeYemenZaireZimbabweAzores
Disability Age 35 to 64
Income
Poverty
Unemployment
Labor Participation
Family Structure
Vehicle Availability
Education Level
Disability

Disability Age 35 to 64 Comparison

Immigrants from Lebanon

Immigrants from Korea

Exceptional
Exceptional
10.3%
DISABILITY AGE 35 TO 64
98.9/ 100
METRIC RATING
91st/ 347
METRIC RANK
9.0%
DISABILITY AGE 35 TO 64
100.0/ 100
METRIC RATING
16th/ 347
METRIC RANK

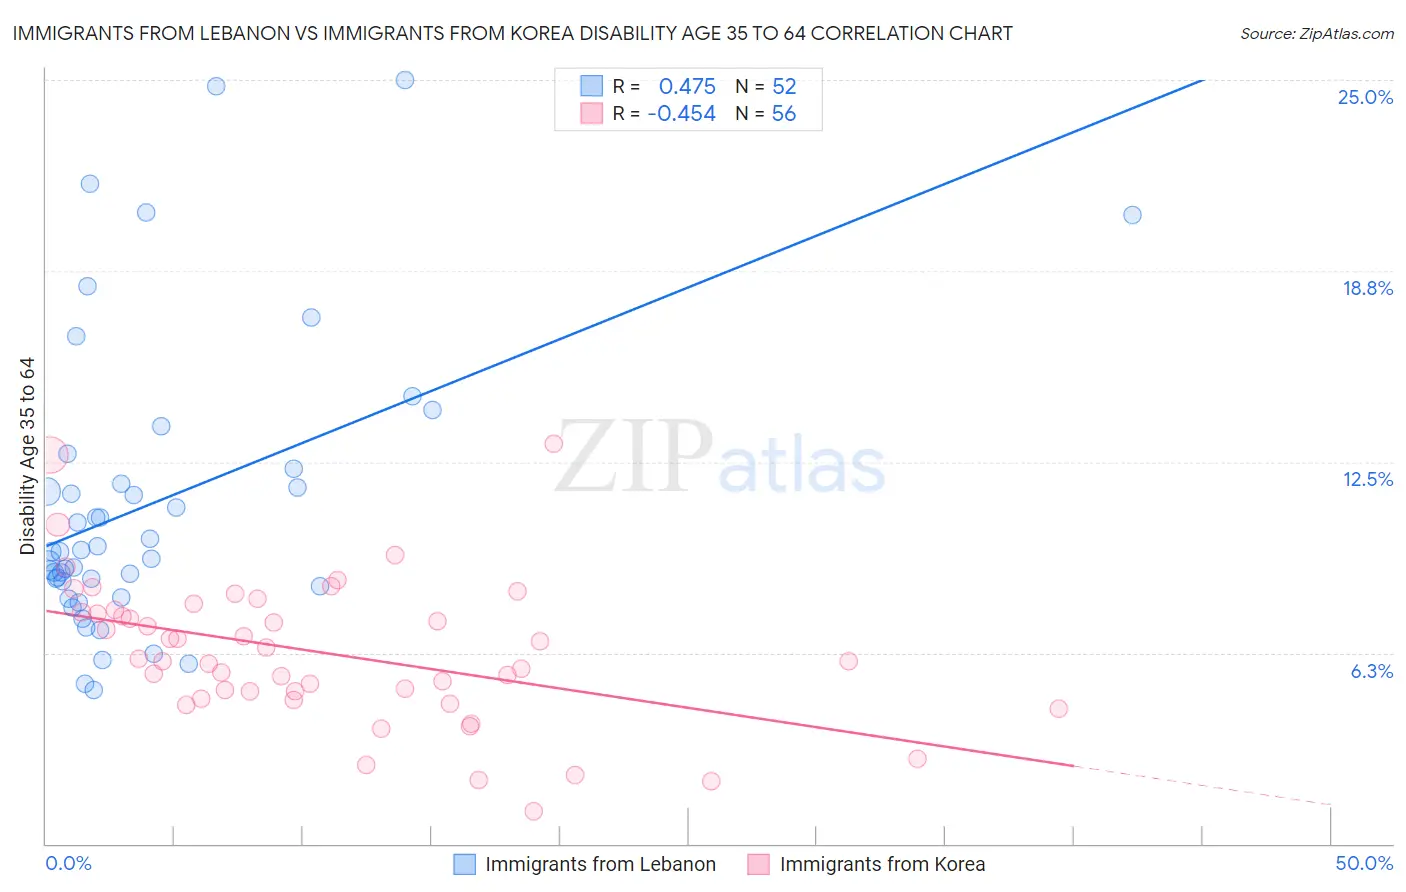
Immigrants from Lebanon vs Immigrants from Korea Disability Age 35 to 64 Correlation Chart

The statistical analysis conducted on geographies consisting of 217,113,313 people shows a moderate positive correlation between the proportion of Immigrants from Lebanon and percentage of population with a disability between the ages 34 and 64 in the United States with a correlation coefficient (R) of 0.475 and weighted average of 10.3%. Similarly, the statistical analysis conducted on geographies consisting of 415,929,521 people shows a moderate negative correlation between the proportion of Immigrants from Korea and percentage of population with a disability between the ages 34 and 64 in the United States with a correlation coefficient (R) of -0.454 and weighted average of 9.0%, a difference of 14.3%.
Immigrants from Lebanon vs Immigrants from Korea Disability Age 35 to 64

Disability Age 35 to 64 Correlation Summary

MeasurementImmigrants from LebanonImmigrants from Korea
Minimum5.0%1.0%
Maximum25.0%13.1%
Range20.0%12.0%
Mean11.1%6.3%
Median9.6%6.0%
Interquartile 25% (IQ1)8.5%4.9%
Interquartile 75% (IQ3)12.0%7.6%
Interquartile Range (IQR)3.5%2.8%
Standard Deviation (Sample)4.7%2.4%
Standard Deviation (Population)4.7%2.4%

Similar Demographics by Disability Age 35 to 64

Demographics Similar to Immigrants from Lebanon by Disability Age 35 to 64

In terms of disability age 35 to 64, the demographic groups most similar to Immigrants from Lebanon are Afghan (10.3%, a difference of 0.010%), Uruguayan (10.2%, a difference of 0.12%), Chilean (10.2%, a difference of 0.14%), Immigrants from Northern Africa (10.3%, a difference of 0.31%), and Immigrants from Europe (10.2%, a difference of 0.37%).
DemographicsRating | RankDisability Age 35 to 64
Sri Lankans
99.2
/100
|
#84
Exceptional
10.2%
Immigrants | Kuwait
99.1
/100
|
#85
Exceptional
10.2%
Immigrants | Europe
99.1
/100
|
#86
Exceptional
10.2%
Nicaraguans
99.1
/100
|
#87
Exceptional
10.2%
Chileans
99.0
/100
|
#88
Exceptional
10.2%
Uruguayans
99.0
/100
|
#89
Exceptional
10.2%
Afghans
98.9
/100
|
#90
Exceptional
10.3%
Immigrants | Lebanon
98.9
/100
|
#91
Exceptional
10.3%
Immigrants | Northern Africa
98.7
/100
|
#92
Exceptional
10.3%
Immigrants | North Macedonia
98.7
/100
|
#93
Exceptional
10.3%
Immigrants | Italy
98.7
/100
|
#94
Exceptional
10.3%
Chinese
98.7
/100
|
#95
Exceptional
10.3%
Immigrants | South Africa
98.5
/100
|
#96
Exceptional
10.3%
Immigrants | Denmark
98.4
/100
|
#97
Exceptional
10.3%
Immigrants | Uruguay
98.3
/100
|
#98
Exceptional
10.3%

Demographics Similar to Immigrants from Korea by Disability Age 35 to 64

In terms of disability age 35 to 64, the demographic groups most similar to Immigrants from Korea are Bolivian (8.9%, a difference of 0.34%), Immigrants from Singapore (8.9%, a difference of 0.63%), Immigrants from South Central Asia (8.9%, a difference of 1.2%), Indian (Asian) (8.9%, a difference of 1.3%), and Immigrants from Eastern Asia (8.8%, a difference of 2.1%).
DemographicsRating | RankDisability Age 35 to 64
Immigrants | China
100.0
/100
|
#9
Exceptional
8.7%
Immigrants | Bolivia
100.0
/100
|
#10
Exceptional
8.7%
Immigrants | Eastern Asia
100.0
/100
|
#11
Exceptional
8.8%
Indians (Asian)
100.0
/100
|
#12
Exceptional
8.9%
Immigrants | South Central Asia
100.0
/100
|
#13
Exceptional
8.9%
Immigrants | Singapore
100.0
/100
|
#14
Exceptional
8.9%
Bolivians
100.0
/100
|
#15
Exceptional
8.9%
Immigrants | Korea
100.0
/100
|
#16
Exceptional
9.0%
Burmese
100.0
/100
|
#17
Exceptional
9.2%
Soviet Union
100.0
/100
|
#18
Exceptional
9.2%
Immigrants | Venezuela
100.0
/100
|
#19
Exceptional
9.3%
Immigrants | Argentina
100.0
/100
|
#20
Exceptional
9.3%
Okinawans
100.0
/100
|
#21
Exceptional
9.4%
Cypriots
100.0
/100
|
#22
Exceptional
9.4%
Argentineans
100.0
/100
|
#23
Exceptional
9.4%