Immigrants from Laos vs Cambodian Disability Age 35 to 64
COMPARE
Immigrants from Laos
Cambodian
Disability Age 35 to 64
Disability Age 35 to 64 Comparison
Immigrants from Laos
Cambodians
13.0%
DISABILITY AGE 35 TO 64
0.1/ 100
METRIC RATING
282nd/ 347
METRIC RANK
9.8%
DISABILITY AGE 35 TO 64
99.8/ 100
METRIC RATING
46th/ 347
METRIC RANK
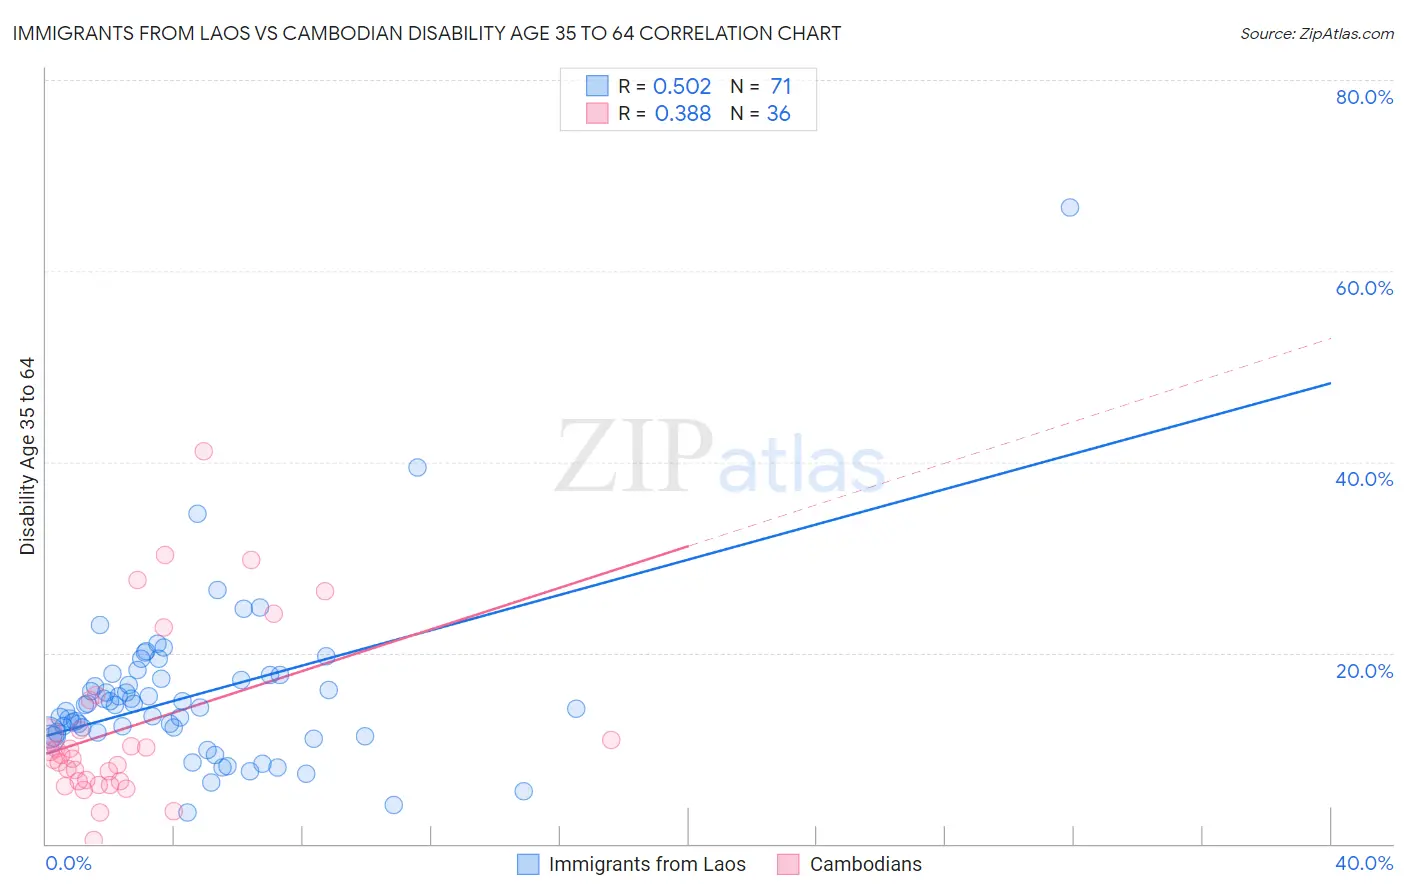
Immigrants from Laos vs Cambodian Disability Age 35 to 64 Correlation Chart
The statistical analysis conducted on geographies consisting of 201,466,921 people shows a substantial positive correlation between the proportion of Immigrants from Laos and percentage of population with a disability between the ages 34 and 64 in the United States with a correlation coefficient (R) of 0.502 and weighted average of 13.0%. Similarly, the statistical analysis conducted on geographies consisting of 102,476,211 people shows a mild positive correlation between the proportion of Cambodians and percentage of population with a disability between the ages 34 and 64 in the United States with a correlation coefficient (R) of 0.388 and weighted average of 9.8%, a difference of 32.2%.
Disability Age 35 to 64 Correlation Summary
| Measurement | Immigrants from Laos | Cambodian |
| Minimum | 3.3% | 0.38% |
| Maximum | 66.7% | 41.2% |
| Range | 63.4% | 40.8% |
| Mean | 15.5% | 12.2% |
| Median | 14.5% | 9.1% |
| Interquartile 25% (IQ1) | 11.5% | 6.5% |
| Interquartile 75% (IQ3) | 17.6% | 13.5% |
| Interquartile Range (IQR) | 6.2% | 7.0% |
| Standard Deviation (Sample) | 8.6% | 9.1% |
| Standard Deviation (Population) | 8.6% | 9.0% |
Similar Demographics by Disability Age 35 to 64
Demographics Similar to Immigrants from Laos by Disability Age 35 to 64
In terms of disability age 35 to 64, the demographic groups most similar to Immigrants from Laos are Scotch-Irish (13.0%, a difference of 0.090%), Liberian (12.9%, a difference of 0.29%), Central American Indian (13.0%, a difference of 0.39%), Immigrants from Micronesia (12.9%, a difference of 0.46%), and French Canadian (12.9%, a difference of 0.48%).
| Demographics | Rating | Rank | Disability Age 35 to 64 |
| Dominicans | 0.1 /100 | #275 | Tragic 12.9% |
| Somalis | 0.1 /100 | #276 | Tragic 12.9% |
| Immigrants | Dominican Republic | 0.1 /100 | #277 | Tragic 12.9% |
| French Canadians | 0.1 /100 | #278 | Tragic 12.9% |
| Immigrants | Micronesia | 0.1 /100 | #279 | Tragic 12.9% |
| Liberians | 0.1 /100 | #280 | Tragic 12.9% |
| Scotch-Irish | 0.1 /100 | #281 | Tragic 13.0% |
| Immigrants | Laos | 0.1 /100 | #282 | Tragic 13.0% |
| Central American Indians | 0.0 /100 | #283 | Tragic 13.0% |
| Immigrants | Nonimmigrants | 0.0 /100 | #284 | Tragic 13.0% |
| Immigrants | Somalia | 0.0 /100 | #285 | Tragic 13.1% |
| Hmong | 0.0 /100 | #286 | Tragic 13.1% |
| Tlingit-Haida | 0.0 /100 | #287 | Tragic 13.2% |
| Fijians | 0.0 /100 | #288 | Tragic 13.2% |
| Indonesians | 0.0 /100 | #289 | Tragic 13.2% |
Demographics Similar to Cambodians by Disability Age 35 to 64
In terms of disability age 35 to 64, the demographic groups most similar to Cambodians are Immigrants from Belgium (9.8%, a difference of 0.050%), Immigrants from Serbia (9.8%, a difference of 0.060%), Immigrants from Greece (9.8%, a difference of 0.11%), Immigrants from Peru (9.8%, a difference of 0.18%), and Paraguayan (9.8%, a difference of 0.18%).
| Demographics | Rating | Rank | Disability Age 35 to 64 |
| Immigrants | Belarus | 99.9 /100 | #39 | Exceptional 9.7% |
| Immigrants | Armenia | 99.9 /100 | #40 | Exceptional 9.7% |
| Israelis | 99.9 /100 | #41 | Exceptional 9.7% |
| Immigrants | Malaysia | 99.9 /100 | #42 | Exceptional 9.7% |
| Immigrants | Colombia | 99.9 /100 | #43 | Exceptional 9.8% |
| Immigrants | Egypt | 99.9 /100 | #44 | Exceptional 9.8% |
| Immigrants | Peru | 99.9 /100 | #45 | Exceptional 9.8% |
| Cambodians | 99.8 /100 | #46 | Exceptional 9.8% |
| Immigrants | Belgium | 99.8 /100 | #47 | Exceptional 9.8% |
| Immigrants | Serbia | 99.8 /100 | #48 | Exceptional 9.8% |
| Immigrants | Greece | 99.8 /100 | #49 | Exceptional 9.8% |
| Paraguayans | 99.8 /100 | #50 | Exceptional 9.8% |
| Bhutanese | 99.8 /100 | #51 | Exceptional 9.8% |
| Immigrants | Bulgaria | 99.8 /100 | #52 | Exceptional 9.8% |
| Taiwanese | 99.8 /100 | #53 | Exceptional 9.8% |