Immigrants from Italy vs Portuguese Disability Age 35 to 64

COMPARE

Immigrants from Italy
Race
Ancestry
AfghanAfricanAlaska NativeAlaskan AthabascanAlbanianAleutAlsatianAmericanApacheArabArapahoArgentineanArmenianAssyrian/Chaldean/SyriacAustralianAustrianBahamianBangladeshiBarbadianBasqueBelgianBelizeanBermudanBhutaneseBlackfeetBolivianBrazilianBritishBritish West IndianBulgarianBurmeseCajunCambodianCanadianCape VerdeanCarpatho RusynCelticCentral AmericanCentral American IndianCherokeeCheyenneChickasawChileanChineseChippewaChoctawColombianColvilleComancheCosta RicanCreeCreekCroatianCrowCubanCypriotCzechCzechoslovakianDanishDelawareDominicanDutchDutch West IndianEastern EuropeanEcuadorianEgyptianEnglishEstonianEthiopianEuropeanFijianFilipinoFinnishFrenchFrench American IndianFrench CanadianGermanGerman RussianGhanaianGreekGuamanian/ChamorroGuatemalanGuyaneseHaitianHmongHonduranHopiHoumaHungarianIcelanderIndian (Asian)IndonesianInupiatIranianIraqiIrishIroquoisIsraeliItalianJamaicanJapaneseJordanianKenyanKiowaKoreanLaotianLatvianLebaneseLiberianLithuanianLumbeeLuxembourgerMacedonianMalaysianMalteseMarshalleseMenomineeMexicanMexican American IndianMongolianMoroccanNative HawaiianNavajoNepaleseNew ZealanderNicaraguanNigerianNorthern EuropeanNorwegianOkinawanOsageOttawaPaiutePakistaniPalestinianPanamanianParaguayanPennsylvania GermanPeruvianPimaPolishPotawatomiPuebloPuerto RicanPuget Sound SalishRomanianRussianSalvadoranSamoanScandinavianScotch-IrishScottishSeminoleSenegaleseSerbianShoshoneSierra LeoneanSiouxSlavicSlovakSloveneSomaliSouth AfricanSouth AmericanSouth American IndianSoviet UnionSpaniardSpanishSpanish AmericanSpanish American IndianSri LankanSubsaharan AfricanSudaneseSwedishSwissSyrianTaiwaneseThaiTlingit-HaidaTohono O'OdhamTonganTrinidadian and TobagonianTsimshianTurkishU.S. Virgin IslanderUgandanUkrainianUruguayanUteVenezuelanVietnameseWelshWest IndianYakamaYaquiYugoslavianYumanYup'ikZimbabwean
Immigration
NonimmigrantsImmigrantsAfghanistanAfricaAlbaniaArgentinaArmeniaAsiaAustraliaAustriaBahamasBangladeshBarbadosBelarusBelgiumBelizeBoliviaBosnia and HerzegovinaBrazilBulgariaBurma/MyanmarCabo VerdeCambodiaCameroonCanadaCaribbeanCentral AmericaChileChinaColombiaCongoCosta RicaCroatiaCubaCzechoslovakiaDenmarkDominicaDominican RepublicEastern AfricaEastern AsiaEastern EuropeEcuadorEgyptEl SalvadorEnglandEritreaEthiopiaEuropeFijiFranceGermanyGhanaGreeceGrenadaGuatemalaGuyanaHaitiHondurasHong KongHungaryIndiaIndonesiaIranIraqIrelandIsraelItalyJamaicaJapanJordanKazakhstanKenyaKoreaKuwaitLaosLatin AmericaLatviaLebanonLiberiaLithuaniaMalaysiaMexicoMicronesiaMiddle AfricaMoldovaMoroccoNepalNetherlandsNicaraguaNigeriaNorth AmericaNorth MacedoniaNorthern AfricaNorthern EuropeNorwayOceaniaPakistanPanamaPeruPhilippinesPolandPortugalRomaniaRussiaSaudi ArabiaScotlandSenegalSerbiaSierra LeoneSingaporeSomaliaSouth AfricaSouth AmericaSouth Central AsiaSouth Eastern AsiaSouthern EuropeSpainSri LankaSt. Vincent and the GrenadinesSudanSwedenSwitzerlandSyriaTaiwanThailandTrinidad and TobagoTurkeyUgandaUkraineUruguayUzbekistanVenezuelaVietnamWest IndiesWestern AfricaWestern AsiaWestern EuropeYemenZaireZimbabweAzores
Portuguese
Race
Ancestry
AfghanAfricanAlaska NativeAlaskan AthabascanAlbanianAleutAlsatianAmericanApacheArabArapahoArgentineanArmenianAssyrian/Chaldean/SyriacAustralianAustrianBahamianBangladeshiBarbadianBasqueBelgianBelizeanBermudanBhutaneseBlackfeetBolivianBrazilianBritishBritish West IndianBulgarianBurmeseCajunCambodianCanadianCape VerdeanCarpatho RusynCelticCentral AmericanCentral American IndianCherokeeCheyenneChickasawChileanChineseChippewaChoctawColombianColvilleComancheCosta RicanCreeCreekCroatianCrowCubanCypriotCzechCzechoslovakianDanishDelawareDominicanDutchDutch West IndianEastern EuropeanEcuadorianEgyptianEnglishEstonianEthiopianEuropeanFijianFilipinoFinnishFrenchFrench American IndianFrench CanadianGermanGerman RussianGhanaianGreekGuamanian/ChamorroGuatemalanGuyaneseHaitianHmongHonduranHopiHoumaHungarianIcelanderIndian (Asian)IndonesianInupiatIranianIraqiIrishIroquoisIsraeliItalianJamaicanJapaneseJordanianKenyanKiowaKoreanLaotianLatvianLebaneseLiberianLithuanianLumbeeLuxembourgerMacedonianMalaysianMalteseMarshalleseMenomineeMexicanMexican American IndianMongolianMoroccanNative HawaiianNavajoNepaleseNew ZealanderNicaraguanNigerianNorthern EuropeanNorwegianOkinawanOsageOttawaPaiutePakistaniPalestinianPanamanianParaguayanPennsylvania GermanPeruvianPimaPolishPortuguesePotawatomiPuebloPuerto RicanPuget Sound SalishRomanianRussianSalvadoranSamoanScandinavianScotch-IrishScottishSeminoleSenegaleseSerbianShoshoneSierra LeoneanSiouxSlavicSlovakSloveneSomaliSouth AfricanSouth AmericanSouth American IndianSoviet UnionSpaniardSpanishSpanish AmericanSpanish American IndianSri LankanSubsaharan AfricanSudaneseSwedishSwissSyrianTaiwaneseThaiTlingit-HaidaTohono O'OdhamTonganTrinidadian and TobagonianTsimshianTurkishU.S. Virgin IslanderUgandanUkrainianUruguayanUteVenezuelanVietnameseWelshWest IndianYakamaYaquiYugoslavianYumanYup'ikZimbabwean
Immigration
NonimmigrantsImmigrantsAfghanistanAfricaAlbaniaArgentinaArmeniaAsiaAustraliaAustriaBahamasBangladeshBarbadosBelarusBelgiumBelizeBoliviaBosnia and HerzegovinaBrazilBulgariaBurma/MyanmarCabo VerdeCambodiaCameroonCanadaCaribbeanCentral AmericaChileChinaColombiaCongoCosta RicaCroatiaCubaCzechoslovakiaDenmarkDominicaDominican RepublicEastern AfricaEastern AsiaEastern EuropeEcuadorEgyptEl SalvadorEnglandEritreaEthiopiaEuropeFijiFranceGermanyGhanaGreeceGrenadaGuatemalaGuyanaHaitiHondurasHong KongHungaryIndiaIndonesiaIranIraqIrelandIsraelJamaicaJapanJordanKazakhstanKenyaKoreaKuwaitLaosLatin AmericaLatviaLebanonLiberiaLithuaniaMalaysiaMexicoMicronesiaMiddle AfricaMoldovaMoroccoNepalNetherlandsNicaraguaNigeriaNorth AmericaNorth MacedoniaNorthern AfricaNorthern EuropeNorwayOceaniaPakistanPanamaPeruPhilippinesPolandPortugalRomaniaRussiaSaudi ArabiaScotlandSenegalSerbiaSierra LeoneSingaporeSomaliaSouth AfricaSouth AmericaSouth Central AsiaSouth Eastern AsiaSouthern EuropeSpainSri LankaSt. Vincent and the GrenadinesSudanSwedenSwitzerlandSyriaTaiwanThailandTrinidad and TobagoTurkeyUgandaUkraineUruguayUzbekistanVenezuelaVietnamWest IndiesWestern AfricaWestern AsiaWestern EuropeYemenZaireZimbabweAzores
Disability Age 35 to 64
Income
Poverty
Unemployment
Labor Participation
Family Structure
Vehicle Availability
Education Level
Disability

Disability Age 35 to 64 Comparison

Immigrants from Italy

Portuguese

Exceptional
Tragic
10.3%
DISABILITY AGE 35 TO 64
98.7/ 100
METRIC RATING
94th/ 347
METRIC RANK
11.9%
DISABILITY AGE 35 TO 64
4.9/ 100
METRIC RATING
234th/ 347
METRIC RANK

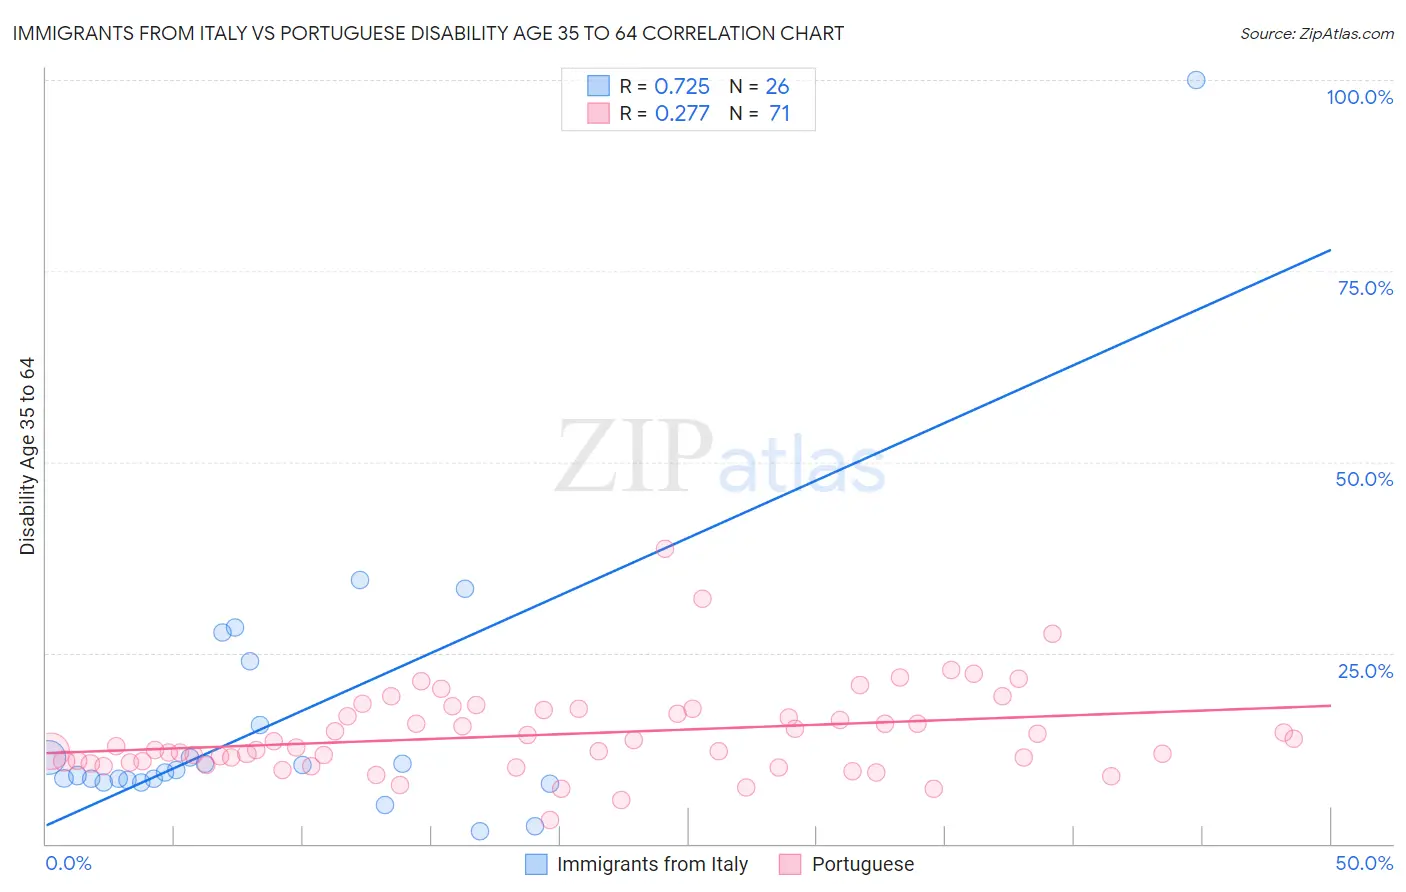
Immigrants from Italy vs Portuguese Disability Age 35 to 64 Correlation Chart

The statistical analysis conducted on geographies consisting of 324,102,618 people shows a strong positive correlation between the proportion of Immigrants from Italy and percentage of population with a disability between the ages 34 and 64 in the United States with a correlation coefficient (R) of 0.725 and weighted average of 10.3%. Similarly, the statistical analysis conducted on geographies consisting of 449,875,842 people shows a weak positive correlation between the proportion of Portuguese and percentage of population with a disability between the ages 34 and 64 in the United States with a correlation coefficient (R) of 0.277 and weighted average of 11.9%, a difference of 16.0%.
Immigrants from Italy vs Portuguese Disability Age 35 to 64

Disability Age 35 to 64 Correlation Summary

MeasurementImmigrants from ItalyPortuguese
Minimum1.6%3.1%
Maximum100.0%38.6%
Range98.4%35.5%
Mean16.2%14.3%
Median9.5%12.7%
Interquartile 25% (IQ1)8.3%10.6%
Interquartile 75% (IQ3)15.5%17.6%
Interquartile Range (IQR)7.2%7.0%
Standard Deviation (Sample)19.3%5.8%
Standard Deviation (Population)18.9%5.8%

Similar Demographics by Disability Age 35 to 64

Demographics Similar to Immigrants from Italy by Disability Age 35 to 64

In terms of disability age 35 to 64, the demographic groups most similar to Immigrants from Italy are Chinese (10.3%, a difference of 0.0%), Immigrants from North Macedonia (10.3%, a difference of 0.040%), Immigrants from Northern Africa (10.3%, a difference of 0.12%), Immigrants from South Africa (10.3%, a difference of 0.24%), and Immigrants from Denmark (10.3%, a difference of 0.42%).
DemographicsRating | RankDisability Age 35 to 64
Nicaraguans
99.1
/100
|
#87
Exceptional
10.2%
Chileans
99.0
/100
|
#88
Exceptional
10.2%
Uruguayans
99.0
/100
|
#89
Exceptional
10.2%
Afghans
98.9
/100
|
#90
Exceptional
10.3%
Immigrants | Lebanon
98.9
/100
|
#91
Exceptional
10.3%
Immigrants | Northern Africa
98.7
/100
|
#92
Exceptional
10.3%
Immigrants | North Macedonia
98.7
/100
|
#93
Exceptional
10.3%
Immigrants | Italy
98.7
/100
|
#94
Exceptional
10.3%
Chinese
98.7
/100
|
#95
Exceptional
10.3%
Immigrants | South Africa
98.5
/100
|
#96
Exceptional
10.3%
Immigrants | Denmark
98.4
/100
|
#97
Exceptional
10.3%
Immigrants | Uruguay
98.3
/100
|
#98
Exceptional
10.3%
Palestinians
98.2
/100
|
#99
Exceptional
10.4%
Immigrants | Jordan
98.1
/100
|
#100
Exceptional
10.4%
Immigrants | Philippines
98.0
/100
|
#101
Exceptional
10.4%

Demographics Similar to Portuguese by Disability Age 35 to 64

In terms of disability age 35 to 64, the demographic groups most similar to Portuguese are Bermudan (11.9%, a difference of 0.070%), Belizean (12.0%, a difference of 0.13%), Immigrants from Middle Africa (12.0%, a difference of 0.15%), Sudanese (11.9%, a difference of 0.18%), and Jamaican (11.9%, a difference of 0.32%).
DemographicsRating | RankDisability Age 35 to 64
Immigrants | Central America
6.3
/100
|
#227
Tragic
11.9%
Immigrants | Germany
6.2
/100
|
#228
Tragic
11.9%
British West Indians
6.1
/100
|
#229
Tragic
11.9%
Panamanians
5.8
/100
|
#230
Tragic
11.9%
Jamaicans
5.7
/100
|
#231
Tragic
11.9%
Sudanese
5.3
/100
|
#232
Tragic
11.9%
Bermudans
5.0
/100
|
#233
Tragic
11.9%
Portuguese
4.9
/100
|
#234
Tragic
11.9%
Belizeans
4.5
/100
|
#235
Tragic
12.0%
Immigrants | Middle Africa
4.5
/100
|
#236
Tragic
12.0%
Immigrants | Cambodia
3.9
/100
|
#237
Tragic
12.0%
West Indians
3.7
/100
|
#238
Tragic
12.0%
Immigrants | Western Africa
3.3
/100
|
#239
Tragic
12.0%
Immigrants | Thailand
3.3
/100
|
#240
Tragic
12.0%
Mexican American Indians
3.2
/100
|
#241
Tragic
12.0%