Immigrants from Israel vs Slovene Disability Age Over 75
COMPARE
Immigrants from Israel
Slovene
Disability Age Over 75
Disability Age Over 75 Comparison
Immigrants from Israel
Slovenes
45.9%
DISABILITY AGE OVER 75
99.6/ 100
METRIC RATING
58th/ 347
METRIC RANK
45.6%
DISABILITY AGE OVER 75
99.9/ 100
METRIC RATING
40th/ 347
METRIC RANK
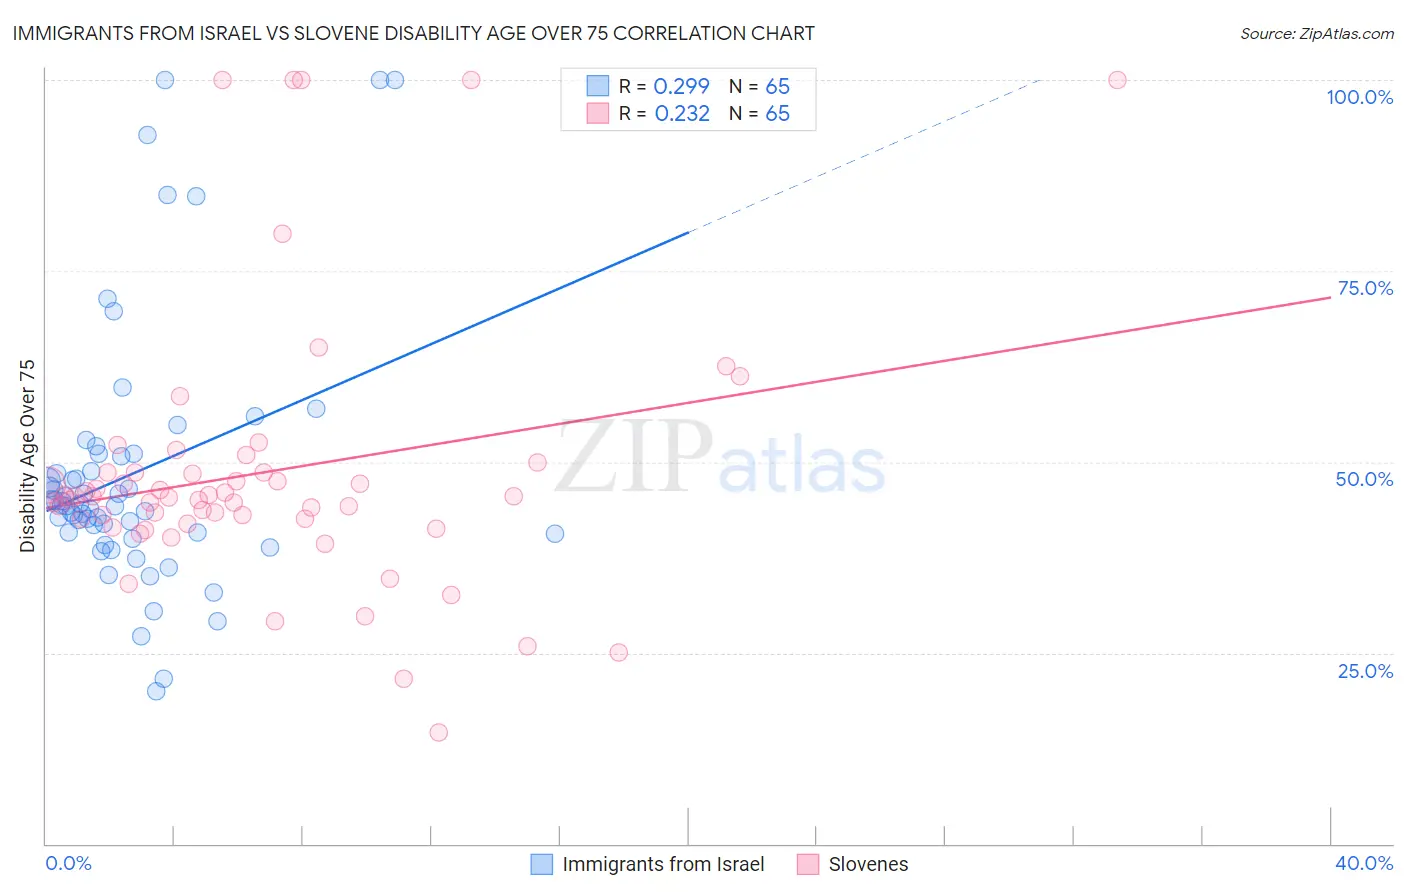
Immigrants from Israel vs Slovene Disability Age Over 75 Correlation Chart
The statistical analysis conducted on geographies consisting of 209,886,024 people shows a weak positive correlation between the proportion of Immigrants from Israel and percentage of population with a disability over the age of 75 in the United States with a correlation coefficient (R) of 0.299 and weighted average of 45.9%. Similarly, the statistical analysis conducted on geographies consisting of 261,143,401 people shows a weak positive correlation between the proportion of Slovenes and percentage of population with a disability over the age of 75 in the United States with a correlation coefficient (R) of 0.232 and weighted average of 45.6%, a difference of 0.60%.
Disability Age Over 75 Correlation Summary
| Measurement | Immigrants from Israel | Slovene |
| Minimum | 20.0% | 14.5% |
| Maximum | 100.0% | 100.0% |
| Range | 80.0% | 85.5% |
| Mean | 48.5% | 48.7% |
| Median | 44.4% | 45.4% |
| Interquartile 25% (IQ1) | 40.6% | 42.2% |
| Interquartile 75% (IQ3) | 50.9% | 48.6% |
| Interquartile Range (IQR) | 10.3% | 6.5% |
| Standard Deviation (Sample) | 17.1% | 17.8% |
| Standard Deviation (Population) | 16.9% | 17.6% |
Demographics Similar to Immigrants from Israel and Slovenes by Disability Age Over 75
In terms of disability age over 75, the demographic groups most similar to Immigrants from Israel are Immigrants from Turkey (45.9%, a difference of 0.0%), Iranian (45.9%, a difference of 0.010%), Immigrants from Netherlands (45.9%, a difference of 0.020%), Maltese (45.8%, a difference of 0.080%), and Slovak (45.8%, a difference of 0.090%). Similarly, the demographic groups most similar to Slovenes are Immigrants from Singapore (45.6%, a difference of 0.030%), Estonian (45.6%, a difference of 0.050%), Greek (45.6%, a difference of 0.080%), Czech (45.7%, a difference of 0.080%), and Australian (45.7%, a difference of 0.12%).
| Demographics | Rating | Rank | Disability Age Over 75 |
| Estonians | 99.9 /100 | #39 | Exceptional 45.6% |
| Slovenes | 99.9 /100 | #40 | Exceptional 45.6% |
| Immigrants | Singapore | 99.8 /100 | #41 | Exceptional 45.6% |
| Greeks | 99.8 /100 | #42 | Exceptional 45.6% |
| Czechs | 99.8 /100 | #43 | Exceptional 45.7% |
| Australians | 99.8 /100 | #44 | Exceptional 45.7% |
| Turks | 99.8 /100 | #45 | Exceptional 45.7% |
| Swedes | 99.8 /100 | #46 | Exceptional 45.7% |
| Immigrants | Canada | 99.8 /100 | #47 | Exceptional 45.7% |
| Croatians | 99.8 /100 | #48 | Exceptional 45.7% |
| Immigrants | North America | 99.8 /100 | #49 | Exceptional 45.7% |
| Belgians | 99.7 /100 | #50 | Exceptional 45.8% |
| Immigrants | Korea | 99.7 /100 | #51 | Exceptional 45.8% |
| Immigrants | France | 99.7 /100 | #52 | Exceptional 45.8% |
| Immigrants | Italy | 99.7 /100 | #53 | Exceptional 45.8% |
| Slovaks | 99.6 /100 | #54 | Exceptional 45.8% |
| Maltese | 99.6 /100 | #55 | Exceptional 45.8% |
| Immigrants | Netherlands | 99.6 /100 | #56 | Exceptional 45.9% |
| Immigrants | Turkey | 99.6 /100 | #57 | Exceptional 45.9% |
| Immigrants | Israel | 99.6 /100 | #58 | Exceptional 45.9% |
| Iranians | 99.6 /100 | #59 | Exceptional 45.9% |