Immigrants from Ireland vs German Disability Age 65 to 74

COMPARE

Immigrants from Ireland
Race
Ancestry
AfghanAfricanAlaska NativeAlaskan AthabascanAlbanianAleutAlsatianAmericanApacheArabArapahoArgentineanArmenianAssyrian/Chaldean/SyriacAustralianAustrianBahamianBangladeshiBarbadianBasqueBelgianBelizeanBermudanBhutaneseBlackfeetBolivianBrazilianBritishBritish West IndianBulgarianBurmeseCajunCambodianCanadianCape VerdeanCarpatho RusynCelticCentral AmericanCentral American IndianCherokeeCheyenneChickasawChileanChineseChippewaChoctawColombianColvilleComancheCosta RicanCreeCreekCroatianCrowCubanCypriotCzechCzechoslovakianDanishDelawareDominicanDutchDutch West IndianEastern EuropeanEcuadorianEgyptianEnglishEstonianEthiopianEuropeanFijianFilipinoFinnishFrenchFrench American IndianFrench CanadianGerman RussianGhanaianGreekGuamanian/ChamorroGuatemalanGuyaneseHaitianHmongHonduranHopiHoumaHungarianIcelanderIndian (Asian)IndonesianInupiatIranianIraqiIrishIroquoisIsraeliItalianJamaicanJapaneseJordanianKenyanKiowaKoreanLaotianLatvianLebaneseLiberianLithuanianLumbeeLuxembourgerMacedonianMalaysianMalteseMarshalleseMenomineeMexicanMexican American IndianMongolianMoroccanNative HawaiianNavajoNepaleseNew ZealanderNicaraguanNigerianNorthern EuropeanNorwegianOkinawanOsageOttawaPaiutePakistaniPalestinianPanamanianParaguayanPennsylvania GermanPeruvianPimaPolishPortuguesePotawatomiPuebloPuerto RicanPuget Sound SalishRomanianRussianSalvadoranSamoanScandinavianScotch-IrishScottishSeminoleSenegaleseSerbianShoshoneSierra LeoneanSiouxSlavicSlovakSloveneSomaliSouth AfricanSouth AmericanSouth American IndianSoviet UnionSpaniardSpanishSpanish AmericanSpanish American IndianSri LankanSubsaharan AfricanSudaneseSwedishSwissSyrianTaiwaneseThaiTlingit-HaidaTohono O'OdhamTonganTrinidadian and TobagonianTsimshianTurkishU.S. Virgin IslanderUgandanUkrainianUruguayanUteVenezuelanVietnameseWelshWest IndianYakamaYaquiYugoslavianYumanYup'ikZimbabwean
Immigration
NonimmigrantsImmigrantsAfghanistanAfricaAlbaniaArgentinaArmeniaAsiaAustraliaAustriaBahamasBangladeshBarbadosBelarusBelgiumBelizeBoliviaBosnia and HerzegovinaBrazilBulgariaBurma/MyanmarCabo VerdeCambodiaCameroonCanadaCaribbeanCentral AmericaChileChinaColombiaCongoCosta RicaCroatiaCubaCzechoslovakiaDenmarkDominicaDominican RepublicEastern AfricaEastern AsiaEastern EuropeEcuadorEgyptEl SalvadorEnglandEritreaEthiopiaEuropeFijiFranceGermanyGhanaGreeceGrenadaGuatemalaGuyanaHaitiHondurasHong KongHungaryIndiaIndonesiaIranIraqIrelandIsraelItalyJamaicaJapanJordanKazakhstanKenyaKoreaKuwaitLaosLatin AmericaLatviaLebanonLiberiaLithuaniaMalaysiaMexicoMicronesiaMiddle AfricaMoldovaMoroccoNepalNetherlandsNicaraguaNigeriaNorth AmericaNorth MacedoniaNorthern AfricaNorthern EuropeNorwayOceaniaPakistanPanamaPeruPhilippinesPolandPortugalRomaniaRussiaSaudi ArabiaScotlandSenegalSerbiaSierra LeoneSingaporeSomaliaSouth AfricaSouth AmericaSouth Central AsiaSouth Eastern AsiaSouthern EuropeSpainSri LankaSt. Vincent and the GrenadinesSudanSwedenSwitzerlandSyriaTaiwanThailandTrinidad and TobagoTurkeyUgandaUkraineUruguayUzbekistanVenezuelaVietnamWest IndiesWestern AfricaWestern AsiaWestern EuropeYemenZaireZimbabweAzores
German
Race
Ancestry
AfghanAfricanAlaska NativeAlaskan AthabascanAlbanianAleutAlsatianAmericanApacheArabArapahoArgentineanArmenianAssyrian/Chaldean/SyriacAustralianAustrianBahamianBangladeshiBarbadianBasqueBelgianBelizeanBermudanBhutaneseBlackfeetBolivianBrazilianBritishBritish West IndianBulgarianBurmeseCajunCambodianCanadianCape VerdeanCarpatho RusynCelticCentral AmericanCentral American IndianCherokeeCheyenneChickasawChileanChineseChippewaChoctawColombianColvilleComancheCosta RicanCreeCreekCroatianCrowCubanCypriotCzechCzechoslovakianDanishDelawareDominicanDutchDutch West IndianEastern EuropeanEcuadorianEgyptianEnglishEstonianEthiopianEuropeanFijianFilipinoFinnishFrenchFrench American IndianFrench CanadianGermanGerman RussianGhanaianGreekGuamanian/ChamorroGuatemalanGuyaneseHaitianHmongHonduranHopiHoumaHungarianIcelanderIndian (Asian)IndonesianInupiatIranianIraqiIrishIroquoisIsraeliItalianJamaicanJapaneseJordanianKenyanKiowaKoreanLaotianLatvianLebaneseLiberianLithuanianLumbeeLuxembourgerMacedonianMalaysianMalteseMarshalleseMenomineeMexicanMexican American IndianMongolianMoroccanNative HawaiianNavajoNepaleseNew ZealanderNicaraguanNigerianNorthern EuropeanNorwegianOkinawanOsageOttawaPaiutePakistaniPalestinianPanamanianParaguayanPennsylvania GermanPeruvianPimaPolishPortuguesePotawatomiPuebloPuerto RicanPuget Sound SalishRomanianRussianSalvadoranSamoanScandinavianScotch-IrishScottishSeminoleSenegaleseSerbianShoshoneSierra LeoneanSiouxSlavicSlovakSloveneSomaliSouth AfricanSouth AmericanSouth American IndianSoviet UnionSpaniardSpanishSpanish AmericanSpanish American IndianSri LankanSubsaharan AfricanSudaneseSwedishSwissSyrianTaiwaneseThaiTlingit-HaidaTohono O'OdhamTonganTrinidadian and TobagonianTsimshianTurkishU.S. Virgin IslanderUgandanUkrainianUruguayanUteVenezuelanVietnameseWelshWest IndianYakamaYaquiYugoslavianYumanYup'ikZimbabwean
Immigration
NonimmigrantsImmigrantsAfghanistanAfricaAlbaniaArgentinaArmeniaAsiaAustraliaAustriaBahamasBangladeshBarbadosBelarusBelgiumBelizeBoliviaBosnia and HerzegovinaBrazilBulgariaBurma/MyanmarCabo VerdeCambodiaCameroonCanadaCaribbeanCentral AmericaChileChinaColombiaCongoCosta RicaCroatiaCubaCzechoslovakiaDenmarkDominicaDominican RepublicEastern AfricaEastern AsiaEastern EuropeEcuadorEgyptEl SalvadorEnglandEritreaEthiopiaEuropeFijiFranceGermanyGhanaGreeceGrenadaGuatemalaGuyanaHaitiHondurasHong KongHungaryIndiaIndonesiaIranIraqIsraelItalyJamaicaJapanJordanKazakhstanKenyaKoreaKuwaitLaosLatin AmericaLatviaLebanonLiberiaLithuaniaMalaysiaMexicoMicronesiaMiddle AfricaMoldovaMoroccoNepalNetherlandsNicaraguaNigeriaNorth AmericaNorth MacedoniaNorthern AfricaNorthern EuropeNorwayOceaniaPakistanPanamaPeruPhilippinesPolandPortugalRomaniaRussiaSaudi ArabiaScotlandSenegalSerbiaSierra LeoneSingaporeSomaliaSouth AfricaSouth AmericaSouth Central AsiaSouth Eastern AsiaSouthern EuropeSpainSri LankaSt. Vincent and the GrenadinesSudanSwedenSwitzerlandSyriaTaiwanThailandTrinidad and TobagoTurkeyUgandaUkraineUruguayUzbekistanVenezuelaVietnamWest IndiesWestern AfricaWestern AsiaWestern EuropeYemenZaireZimbabweAzores
Disability Age 65 to 74
Income
Poverty
Unemployment
Labor Participation
Family Structure
Vehicle Availability
Education Level
Disability

Disability Age 65 to 74 Comparison

Immigrants from Ireland

Germans

Exceptional
Average
20.3%
DISABILITY AGE 65 TO 74
100.0/ 100
METRIC RATING
11th/ 347
METRIC RANK
23.3%
DISABILITY AGE 65 TO 74
50.5/ 100
METRIC RATING
172nd/ 347
METRIC RANK

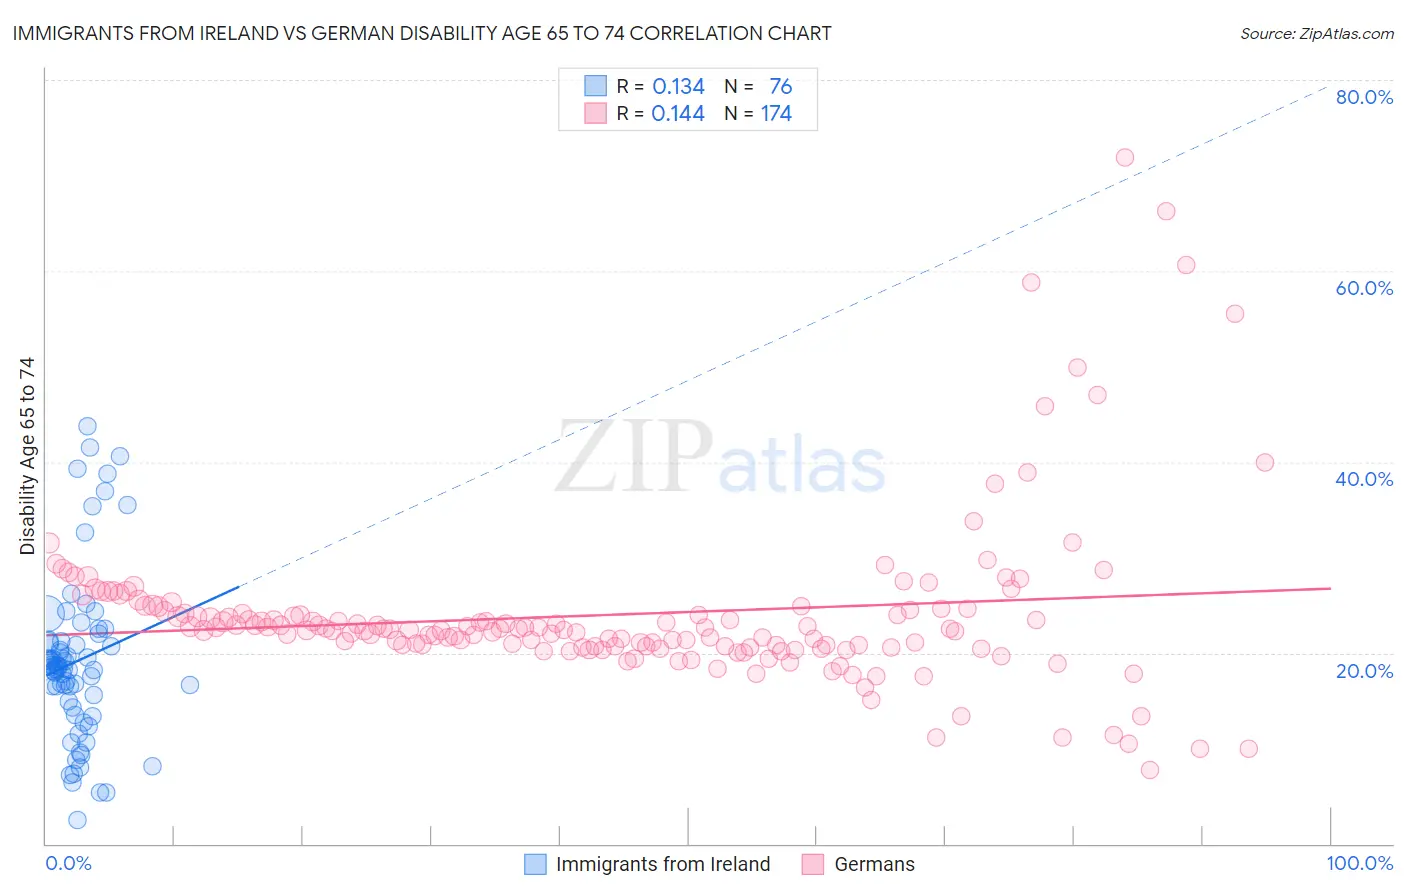
Immigrants from Ireland vs German Disability Age 65 to 74 Correlation Chart

The statistical analysis conducted on geographies consisting of 240,654,975 people shows a poor positive correlation between the proportion of Immigrants from Ireland and percentage of population with a disability between the ages 65 and 75 in the United States with a correlation coefficient (R) of 0.134 and weighted average of 20.3%. Similarly, the statistical analysis conducted on geographies consisting of 577,988,449 people shows a poor positive correlation between the proportion of Germans and percentage of population with a disability between the ages 65 and 75 in the United States with a correlation coefficient (R) of 0.144 and weighted average of 23.3%, a difference of 14.8%.
Immigrants from Ireland vs German Disability Age 65 to 74

Disability Age 65 to 74 Correlation Summary

MeasurementImmigrants from IrelandGerman
Minimum2.4%7.7%
Maximum43.8%71.9%
Range41.3%64.2%
Mean19.1%24.0%
Median18.4%22.5%
Interquartile 25% (IQ1)14.6%20.7%
Interquartile 75% (IQ3)21.2%24.5%
Interquartile Range (IQR)6.6%3.8%
Standard Deviation (Sample)8.7%8.7%
Standard Deviation (Population)8.7%8.7%

Similar Demographics by Disability Age 65 to 74

Demographics Similar to Immigrants from Ireland by Disability Age 65 to 74

In terms of disability age 65 to 74, the demographic groups most similar to Immigrants from Ireland are Immigrants from Eastern Asia (20.3%, a difference of 0.16%), Immigrants from Korea (20.4%, a difference of 0.21%), Immigrants from China (20.3%, a difference of 0.23%), Immigrants from Singapore (20.4%, a difference of 0.60%), and Indian (Asian) (20.5%, a difference of 1.1%).
DemographicsRating | RankDisability Age 65 to 74
Immigrants | Hong Kong
100.0
/100
|
#4
Exceptional
19.9%
Immigrants | Israel
100.0
/100
|
#5
Exceptional
19.9%
Iranians
100.0
/100
|
#6
Exceptional
19.9%
Cypriots
100.0
/100
|
#7
Exceptional
20.1%
Thais
100.0
/100
|
#8
Exceptional
20.1%
Immigrants | China
100.0
/100
|
#9
Exceptional
20.3%
Immigrants | Eastern Asia
100.0
/100
|
#10
Exceptional
20.3%
Immigrants | Ireland
100.0
/100
|
#11
Exceptional
20.3%
Immigrants | Korea
100.0
/100
|
#12
Exceptional
20.4%
Immigrants | Singapore
100.0
/100
|
#13
Exceptional
20.4%
Indians (Asian)
100.0
/100
|
#14
Exceptional
20.5%
Paraguayans
100.0
/100
|
#15
Exceptional
20.5%
Immigrants | Lithuania
100.0
/100
|
#16
Exceptional
20.5%
Immigrants | South Central Asia
100.0
/100
|
#17
Exceptional
20.6%
Eastern Europeans
100.0
/100
|
#18
Exceptional
20.6%

Demographics Similar to Germans by Disability Age 65 to 74

In terms of disability age 65 to 74, the demographic groups most similar to Germans are Yugoslavian (23.3%, a difference of 0.020%), Immigrants from South Eastern Asia (23.3%, a difference of 0.030%), Dutch (23.3%, a difference of 0.070%), Cuban (23.3%, a difference of 0.080%), and Immigrants from Eritrea (23.4%, a difference of 0.17%).
DemographicsRating | RankDisability Age 65 to 74
Vietnamese
60.8
/100
|
#165
Good
23.2%
Immigrants | Afghanistan
60.5
/100
|
#166
Good
23.2%
Immigrants | Bosnia and Herzegovina
57.6
/100
|
#167
Average
23.2%
Pakistanis
57.0
/100
|
#168
Average
23.2%
Icelanders
54.3
/100
|
#169
Average
23.3%
Moroccans
54.2
/100
|
#170
Average
23.3%
Cubans
51.9
/100
|
#171
Average
23.3%
Germans
50.5
/100
|
#172
Average
23.3%
Yugoslavians
50.2
/100
|
#173
Average
23.3%
Immigrants | South Eastern Asia
50.0
/100
|
#174
Average
23.3%
Dutch
49.4
/100
|
#175
Average
23.3%
Immigrants | Eritrea
47.5
/100
|
#176
Average
23.4%
Immigrants | Haiti
47.5
/100
|
#177
Average
23.4%
Guyanese
45.8
/100
|
#178
Average
23.4%
Immigrants | Sierra Leone
45.8
/100
|
#179
Average
23.4%