Immigrants from Ireland vs Chilean Disability Age 35 to 64

COMPARE

Immigrants from Ireland
Race
Ancestry
AfghanAfricanAlaska NativeAlaskan AthabascanAlbanianAleutAlsatianAmericanApacheArabArapahoArgentineanArmenianAssyrian/Chaldean/SyriacAustralianAustrianBahamianBangladeshiBarbadianBasqueBelgianBelizeanBermudanBhutaneseBlackfeetBolivianBrazilianBritishBritish West IndianBulgarianBurmeseCajunCambodianCanadianCape VerdeanCarpatho RusynCelticCentral AmericanCentral American IndianCherokeeCheyenneChickasawChineseChippewaChoctawColombianColvilleComancheCosta RicanCreeCreekCroatianCrowCubanCypriotCzechCzechoslovakianDanishDelawareDominicanDutchDutch West IndianEastern EuropeanEcuadorianEgyptianEnglishEstonianEthiopianEuropeanFijianFilipinoFinnishFrenchFrench American IndianFrench CanadianGermanGerman RussianGhanaianGreekGuamanian/ChamorroGuatemalanGuyaneseHaitianHmongHonduranHopiHoumaHungarianIcelanderIndian (Asian)IndonesianInupiatIranianIraqiIrishIroquoisIsraeliItalianJamaicanJapaneseJordanianKenyanKiowaKoreanLaotianLatvianLebaneseLiberianLithuanianLumbeeLuxembourgerMacedonianMalaysianMalteseMarshalleseMenomineeMexicanMexican American IndianMongolianMoroccanNative HawaiianNavajoNepaleseNew ZealanderNicaraguanNigerianNorthern EuropeanNorwegianOkinawanOsageOttawaPaiutePakistaniPalestinianPanamanianParaguayanPennsylvania GermanPeruvianPimaPolishPortuguesePotawatomiPuebloPuerto RicanPuget Sound SalishRomanianRussianSalvadoranSamoanScandinavianScotch-IrishScottishSeminoleSenegaleseSerbianShoshoneSierra LeoneanSiouxSlavicSlovakSloveneSomaliSouth AfricanSouth AmericanSouth American IndianSoviet UnionSpaniardSpanishSpanish AmericanSpanish American IndianSri LankanSubsaharan AfricanSudaneseSwedishSwissSyrianTaiwaneseThaiTlingit-HaidaTohono O'OdhamTonganTrinidadian and TobagonianTsimshianTurkishU.S. Virgin IslanderUgandanUkrainianUruguayanUteVenezuelanVietnameseWelshWest IndianYakamaYaquiYugoslavianYumanYup'ikZimbabwean
Immigration
NonimmigrantsImmigrantsAfghanistanAfricaAlbaniaArgentinaArmeniaAsiaAustraliaAustriaBahamasBangladeshBarbadosBelarusBelgiumBelizeBoliviaBosnia and HerzegovinaBrazilBulgariaBurma/MyanmarCabo VerdeCambodiaCameroonCanadaCaribbeanCentral AmericaChileChinaColombiaCongoCosta RicaCroatiaCubaCzechoslovakiaDenmarkDominicaDominican RepublicEastern AfricaEastern AsiaEastern EuropeEcuadorEgyptEl SalvadorEnglandEritreaEthiopiaEuropeFijiFranceGermanyGhanaGreeceGrenadaGuatemalaGuyanaHaitiHondurasHong KongHungaryIndiaIndonesiaIranIraqIrelandIsraelItalyJamaicaJapanJordanKazakhstanKenyaKoreaKuwaitLaosLatin AmericaLatviaLebanonLiberiaLithuaniaMalaysiaMexicoMicronesiaMiddle AfricaMoldovaMoroccoNepalNetherlandsNicaraguaNigeriaNorth AmericaNorth MacedoniaNorthern AfricaNorthern EuropeNorwayOceaniaPakistanPanamaPeruPhilippinesPolandPortugalRomaniaRussiaSaudi ArabiaScotlandSenegalSerbiaSierra LeoneSingaporeSomaliaSouth AfricaSouth AmericaSouth Central AsiaSouth Eastern AsiaSouthern EuropeSpainSri LankaSt. Vincent and the GrenadinesSudanSwedenSwitzerlandSyriaTaiwanThailandTrinidad and TobagoTurkeyUgandaUkraineUruguayUzbekistanVenezuelaVietnamWest IndiesWestern AfricaWestern AsiaWestern EuropeYemenZaireZimbabweAzores
Chilean
Race
Ancestry
AfghanAfricanAlaska NativeAlaskan AthabascanAlbanianAleutAlsatianAmericanApacheArabArapahoArgentineanArmenianAssyrian/Chaldean/SyriacAustralianAustrianBahamianBangladeshiBarbadianBasqueBelgianBelizeanBermudanBhutaneseBlackfeetBolivianBrazilianBritishBritish West IndianBulgarianBurmeseCajunCambodianCanadianCape VerdeanCarpatho RusynCelticCentral AmericanCentral American IndianCherokeeCheyenneChickasawChileanChineseChippewaChoctawColombianColvilleComancheCosta RicanCreeCreekCroatianCrowCubanCypriotCzechCzechoslovakianDanishDelawareDominicanDutchDutch West IndianEastern EuropeanEcuadorianEgyptianEnglishEstonianEthiopianEuropeanFijianFilipinoFinnishFrenchFrench American IndianFrench CanadianGermanGerman RussianGhanaianGreekGuamanian/ChamorroGuatemalanGuyaneseHaitianHmongHonduranHopiHoumaHungarianIcelanderIndian (Asian)IndonesianInupiatIranianIraqiIrishIroquoisIsraeliItalianJamaicanJapaneseJordanianKenyanKiowaKoreanLaotianLatvianLebaneseLiberianLithuanianLumbeeLuxembourgerMacedonianMalaysianMalteseMarshalleseMenomineeMexicanMexican American IndianMongolianMoroccanNative HawaiianNavajoNepaleseNew ZealanderNicaraguanNigerianNorthern EuropeanNorwegianOkinawanOsageOttawaPaiutePakistaniPalestinianPanamanianParaguayanPennsylvania GermanPeruvianPimaPolishPortuguesePotawatomiPuebloPuerto RicanPuget Sound SalishRomanianRussianSalvadoranSamoanScandinavianScotch-IrishScottishSeminoleSenegaleseSerbianShoshoneSierra LeoneanSiouxSlavicSlovakSloveneSomaliSouth AfricanSouth AmericanSouth American IndianSoviet UnionSpaniardSpanishSpanish AmericanSpanish American IndianSri LankanSubsaharan AfricanSudaneseSwedishSwissSyrianTaiwaneseThaiTlingit-HaidaTohono O'OdhamTonganTrinidadian and TobagonianTsimshianTurkishU.S. Virgin IslanderUgandanUkrainianUruguayanUteVenezuelanVietnameseWelshWest IndianYakamaYaquiYugoslavianYumanYup'ikZimbabwean
Immigration
NonimmigrantsImmigrantsAfghanistanAfricaAlbaniaArgentinaArmeniaAsiaAustraliaAustriaBahamasBangladeshBarbadosBelarusBelgiumBelizeBoliviaBosnia and HerzegovinaBrazilBulgariaBurma/MyanmarCabo VerdeCambodiaCameroonCanadaCaribbeanCentral AmericaChileChinaColombiaCongoCosta RicaCroatiaCubaCzechoslovakiaDenmarkDominicaDominican RepublicEastern AfricaEastern AsiaEastern EuropeEcuadorEgyptEl SalvadorEnglandEritreaEthiopiaEuropeFijiFranceGermanyGhanaGreeceGrenadaGuatemalaGuyanaHaitiHondurasHong KongHungaryIndiaIndonesiaIranIraqIsraelItalyJamaicaJapanJordanKazakhstanKenyaKoreaKuwaitLaosLatin AmericaLatviaLebanonLiberiaLithuaniaMalaysiaMexicoMicronesiaMiddle AfricaMoldovaMoroccoNepalNetherlandsNicaraguaNigeriaNorth AmericaNorth MacedoniaNorthern AfricaNorthern EuropeNorwayOceaniaPakistanPanamaPeruPhilippinesPolandPortugalRomaniaRussiaSaudi ArabiaScotlandSenegalSerbiaSierra LeoneSingaporeSomaliaSouth AfricaSouth AmericaSouth Central AsiaSouth Eastern AsiaSouthern EuropeSpainSri LankaSt. Vincent and the GrenadinesSudanSwedenSwitzerlandSyriaTaiwanThailandTrinidad and TobagoTurkeyUgandaUkraineUruguayUzbekistanVenezuelaVietnamWest IndiesWestern AfricaWestern AsiaWestern EuropeYemenZaireZimbabweAzores
Disability Age 35 to 64
Income
Poverty
Unemployment
Labor Participation
Family Structure
Vehicle Availability
Education Level
Disability

Disability Age 35 to 64 Comparison

Immigrants from Ireland

Chileans

Exceptional
Exceptional
9.5%
DISABILITY AGE 35 TO 64
100.0/ 100
METRIC RATING
29th/ 347
METRIC RANK
10.2%
DISABILITY AGE 35 TO 64
99.0/ 100
METRIC RATING
88th/ 347
METRIC RANK

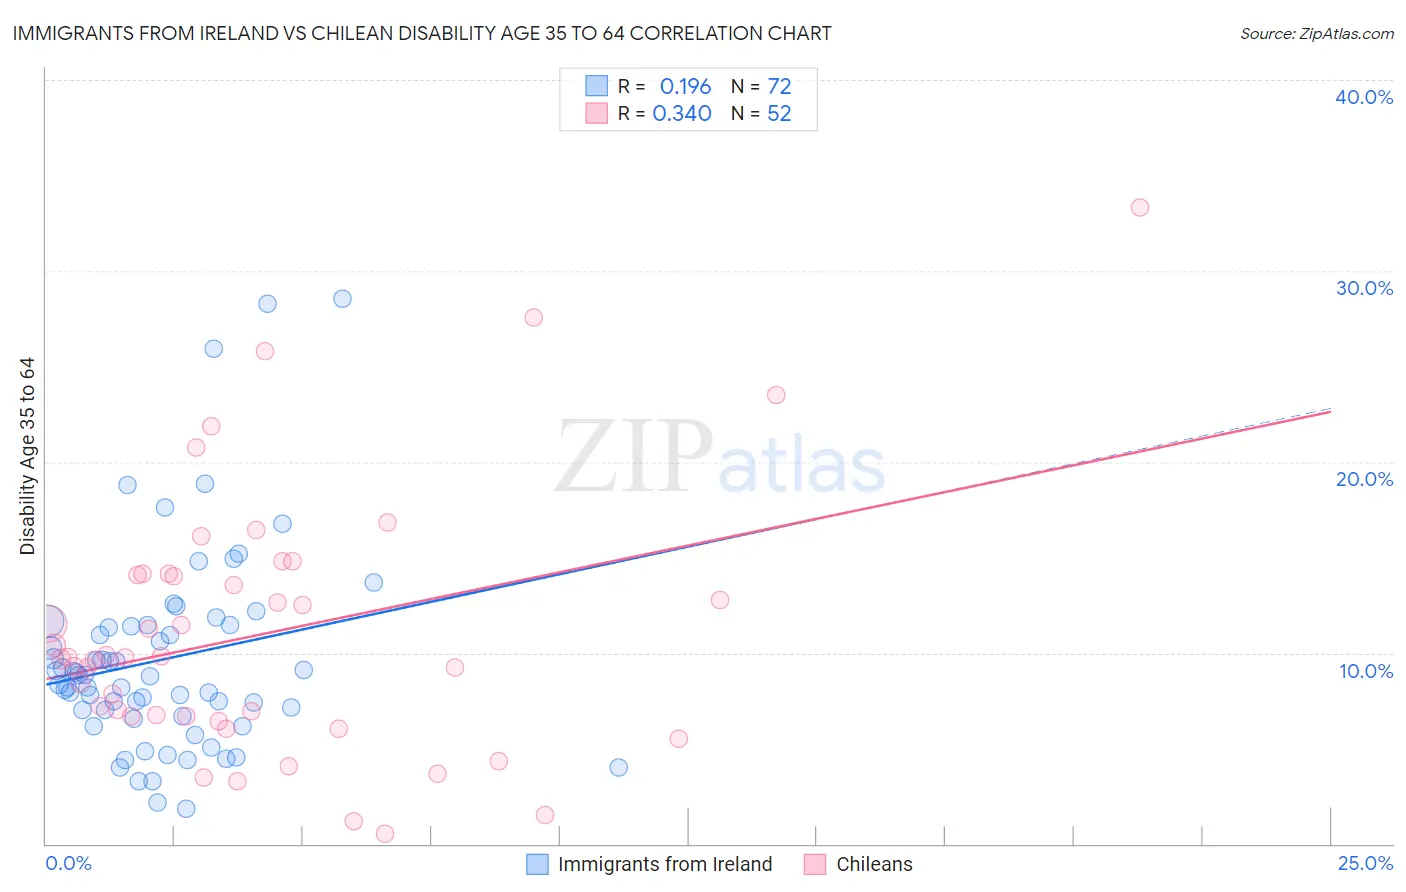
Immigrants from Ireland vs Chilean Disability Age 35 to 64 Correlation Chart

The statistical analysis conducted on geographies consisting of 240,729,151 people shows a poor positive correlation between the proportion of Immigrants from Ireland and percentage of population with a disability between the ages 34 and 64 in the United States with a correlation coefficient (R) of 0.196 and weighted average of 9.5%. Similarly, the statistical analysis conducted on geographies consisting of 256,534,411 people shows a mild positive correlation between the proportion of Chileans and percentage of population with a disability between the ages 34 and 64 in the United States with a correlation coefficient (R) of 0.340 and weighted average of 10.2%, a difference of 7.3%.
Immigrants from Ireland vs Chilean Disability Age 35 to 64

Disability Age 35 to 64 Correlation Summary

MeasurementImmigrants from IrelandChilean
Minimum1.8%0.50%
Maximum28.6%33.3%
Range26.8%32.8%
Mean9.7%11.0%
Median8.8%9.8%
Interquartile 25% (IQ1)6.8%6.7%
Interquartile 75% (IQ3)11.4%14.1%
Interquartile Range (IQR)4.6%7.4%
Standard Deviation (Sample)5.3%6.8%
Standard Deviation (Population)5.2%6.7%

Similar Demographics by Disability Age 35 to 64

Demographics Similar to Immigrants from Ireland by Disability Age 35 to 64

In terms of disability age 35 to 64, the demographic groups most similar to Immigrants from Ireland are Immigrants from Japan (9.5%, a difference of 0.040%), Immigrants from Pakistan (9.5%, a difference of 0.45%), Immigrants from Lithuania (9.6%, a difference of 0.53%), Immigrants from Asia (9.5%, a difference of 0.62%), and Immigrants from Sri Lanka (9.5%, a difference of 0.84%).
DemographicsRating | RankDisability Age 35 to 64
Cypriots
100.0
/100
|
#22
Exceptional
9.4%
Argentineans
100.0
/100
|
#23
Exceptional
9.4%
Asians
100.0
/100
|
#24
Exceptional
9.4%
Venezuelans
100.0
/100
|
#25
Exceptional
9.4%
Immigrants | Sri Lanka
100.0
/100
|
#26
Exceptional
9.5%
Immigrants | Asia
100.0
/100
|
#27
Exceptional
9.5%
Immigrants | Pakistan
100.0
/100
|
#28
Exceptional
9.5%
Immigrants | Ireland
100.0
/100
|
#29
Exceptional
9.5%
Immigrants | Japan
100.0
/100
|
#30
Exceptional
9.5%
Immigrants | Lithuania
99.9
/100
|
#31
Exceptional
9.6%
Turks
99.9
/100
|
#32
Exceptional
9.7%
Immigrants | Indonesia
99.9
/100
|
#33
Exceptional
9.7%
Immigrants | Australia
99.9
/100
|
#34
Exceptional
9.7%
Bulgarians
99.9
/100
|
#35
Exceptional
9.7%
Immigrants | Cuba
99.9
/100
|
#36
Exceptional
9.7%

Demographics Similar to Chileans by Disability Age 35 to 64

In terms of disability age 35 to 64, the demographic groups most similar to Chileans are Uruguayan (10.2%, a difference of 0.010%), Afghan (10.3%, a difference of 0.12%), Immigrants from Lebanon (10.3%, a difference of 0.14%), Nicaraguan (10.2%, a difference of 0.23%), and Immigrants from Europe (10.2%, a difference of 0.24%).
DemographicsRating | RankDisability Age 35 to 64
Latvians
99.2
/100
|
#81
Exceptional
10.2%
Russians
99.2
/100
|
#82
Exceptional
10.2%
Immigrants | Brazil
99.2
/100
|
#83
Exceptional
10.2%
Sri Lankans
99.2
/100
|
#84
Exceptional
10.2%
Immigrants | Kuwait
99.1
/100
|
#85
Exceptional
10.2%
Immigrants | Europe
99.1
/100
|
#86
Exceptional
10.2%
Nicaraguans
99.1
/100
|
#87
Exceptional
10.2%
Chileans
99.0
/100
|
#88
Exceptional
10.2%
Uruguayans
99.0
/100
|
#89
Exceptional
10.2%
Afghans
98.9
/100
|
#90
Exceptional
10.3%
Immigrants | Lebanon
98.9
/100
|
#91
Exceptional
10.3%
Immigrants | Northern Africa
98.7
/100
|
#92
Exceptional
10.3%
Immigrants | North Macedonia
98.7
/100
|
#93
Exceptional
10.3%
Immigrants | Italy
98.7
/100
|
#94
Exceptional
10.3%
Chinese
98.7
/100
|
#95
Exceptional
10.3%