Immigrants from Indonesia vs Immigrants from Poland Vision Disability
COMPARE
Immigrants from Indonesia
Immigrants from Poland
Vision Disability
Vision Disability Comparison
Immigrants from Indonesia
Immigrants from Poland
2.0%
VISION DISABILITY
99.7/ 100
METRIC RATING
44th/ 347
METRIC RANK
2.0%
VISION DISABILITY
97.6/ 100
METRIC RATING
82nd/ 347
METRIC RANK
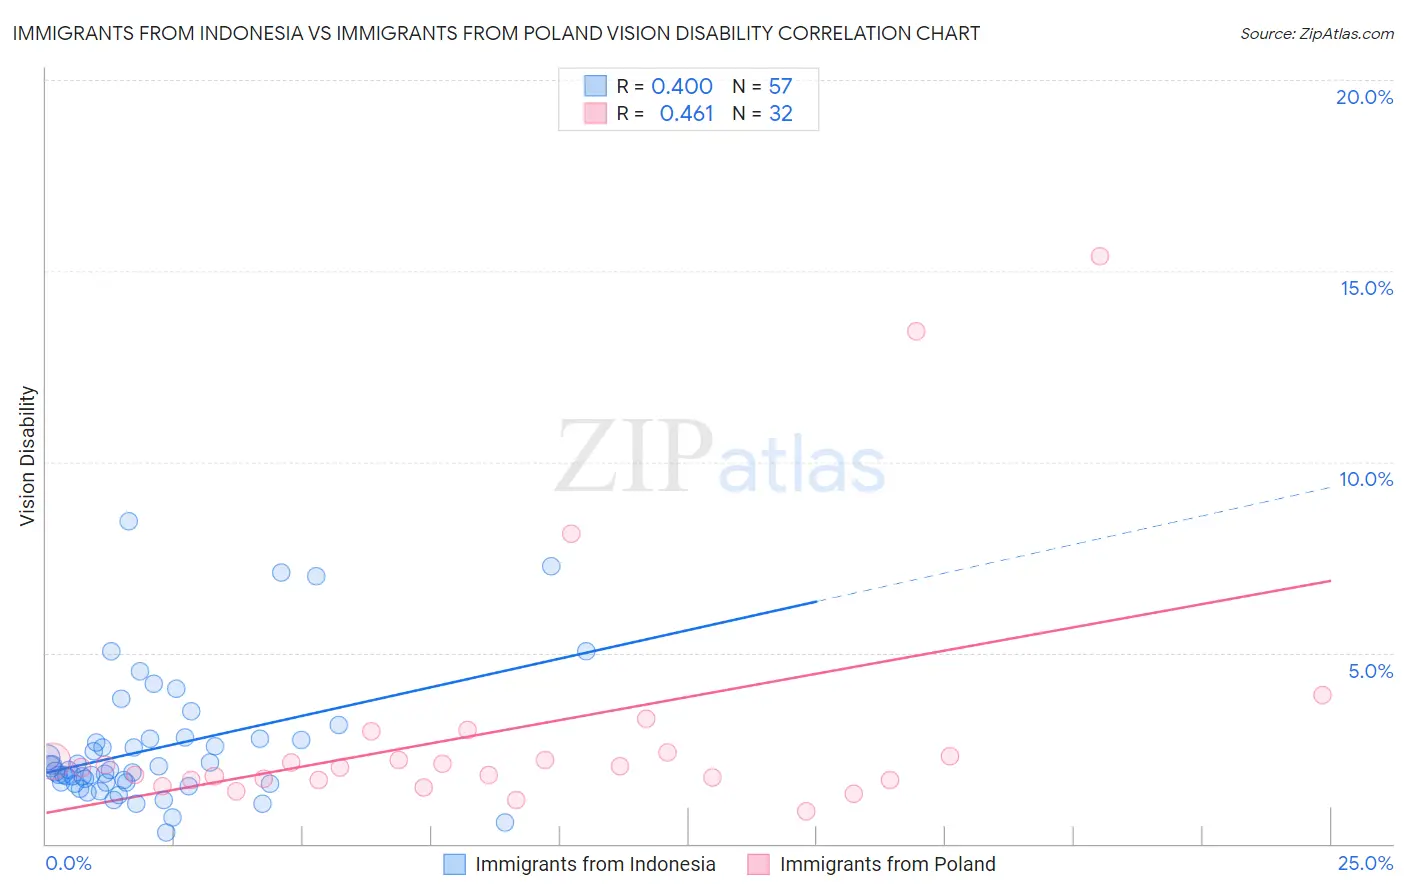
Immigrants from Indonesia vs Immigrants from Poland Vision Disability Correlation Chart
The statistical analysis conducted on geographies consisting of 215,759,467 people shows a moderate positive correlation between the proportion of Immigrants from Indonesia and percentage of population with vision disability in the United States with a correlation coefficient (R) of 0.400 and weighted average of 2.0%. Similarly, the statistical analysis conducted on geographies consisting of 304,657,197 people shows a moderate positive correlation between the proportion of Immigrants from Poland and percentage of population with vision disability in the United States with a correlation coefficient (R) of 0.461 and weighted average of 2.0%, a difference of 3.5%.
Vision Disability Correlation Summary
| Measurement | Immigrants from Indonesia | Immigrants from Poland |
| Minimum | 0.29% | 0.85% |
| Maximum | 8.4% | 15.4% |
| Range | 8.1% | 14.5% |
| Mean | 2.5% | 3.0% |
| Median | 1.9% | 2.0% |
| Interquartile 25% (IQ1) | 1.6% | 1.7% |
| Interquartile 75% (IQ3) | 2.7% | 2.3% |
| Interquartile Range (IQR) | 1.1% | 0.66% |
| Standard Deviation (Sample) | 1.7% | 3.3% |
| Standard Deviation (Population) | 1.7% | 3.2% |
Similar Demographics by Vision Disability
Demographics Similar to Immigrants from Indonesia by Vision Disability
In terms of vision disability, the demographic groups most similar to Immigrants from Indonesia are Eastern European (2.0%, a difference of 0.020%), Ethiopian (2.0%, a difference of 0.030%), Immigrants from Sweden (2.0%, a difference of 0.070%), Immigrants from Ethiopia (2.0%, a difference of 0.090%), and Immigrants from Bulgaria (2.0%, a difference of 0.090%).
| Demographics | Rating | Rank | Vision Disability |
| Bhutanese | 99.8 /100 | #37 | Exceptional 2.0% |
| Immigrants | Kuwait | 99.8 /100 | #38 | Exceptional 2.0% |
| Zimbabweans | 99.7 /100 | #39 | Exceptional 2.0% |
| Immigrants | Ireland | 99.7 /100 | #40 | Exceptional 2.0% |
| Cypriots | 99.7 /100 | #41 | Exceptional 2.0% |
| Immigrants | Ethiopia | 99.7 /100 | #42 | Exceptional 2.0% |
| Eastern Europeans | 99.7 /100 | #43 | Exceptional 2.0% |
| Immigrants | Indonesia | 99.7 /100 | #44 | Exceptional 2.0% |
| Ethiopians | 99.7 /100 | #45 | Exceptional 2.0% |
| Immigrants | Sweden | 99.7 /100 | #46 | Exceptional 2.0% |
| Immigrants | Bulgaria | 99.7 /100 | #47 | Exceptional 2.0% |
| Israelis | 99.6 /100 | #48 | Exceptional 2.0% |
| Latvians | 99.5 /100 | #49 | Exceptional 2.0% |
| Afghans | 99.5 /100 | #50 | Exceptional 2.0% |
| Tongans | 99.5 /100 | #51 | Exceptional 2.0% |
Demographics Similar to Immigrants from Poland by Vision Disability
In terms of vision disability, the demographic groups most similar to Immigrants from Poland are Soviet Union (2.0%, a difference of 0.020%), Immigrants from Western Asia (2.0%, a difference of 0.080%), Lithuanian (2.0%, a difference of 0.090%), Immigrants from Latvia (2.0%, a difference of 0.20%), and Chinese (2.0%, a difference of 0.26%).
| Demographics | Rating | Rank | Vision Disability |
| Immigrants | North Macedonia | 98.3 /100 | #75 | Exceptional 2.0% |
| Paraguayans | 98.3 /100 | #76 | Exceptional 2.0% |
| Immigrants | Jordan | 98.3 /100 | #77 | Exceptional 2.0% |
| Immigrants | Eastern Europe | 98.3 /100 | #78 | Exceptional 2.0% |
| Assyrians/Chaldeans/Syriacs | 98.1 /100 | #79 | Exceptional 2.0% |
| Lithuanians | 97.7 /100 | #80 | Exceptional 2.0% |
| Soviet Union | 97.6 /100 | #81 | Exceptional 2.0% |
| Immigrants | Poland | 97.6 /100 | #82 | Exceptional 2.0% |
| Immigrants | Western Asia | 97.5 /100 | #83 | Exceptional 2.0% |
| Immigrants | Latvia | 97.3 /100 | #84 | Exceptional 2.0% |
| Chinese | 97.2 /100 | #85 | Exceptional 2.0% |
| Immigrants | Moldova | 97.2 /100 | #86 | Exceptional 2.0% |
| Immigrants | Switzerland | 97.0 /100 | #87 | Exceptional 2.0% |
| Norwegians | 97.0 /100 | #88 | Exceptional 2.0% |
| Immigrants | Eastern Africa | 97.0 /100 | #89 | Exceptional 2.0% |