Immigrants from India vs Turkish Hearing Disability
COMPARE
Immigrants from India
Turkish
Hearing Disability
Hearing Disability Comparison
Immigrants from India
Turks
2.5%
HEARING DISABILITY
99.9/ 100
METRIC RATING
17th/ 347
METRIC RANK
2.8%
HEARING DISABILITY
93.0/ 100
METRIC RATING
109th/ 347
METRIC RANK
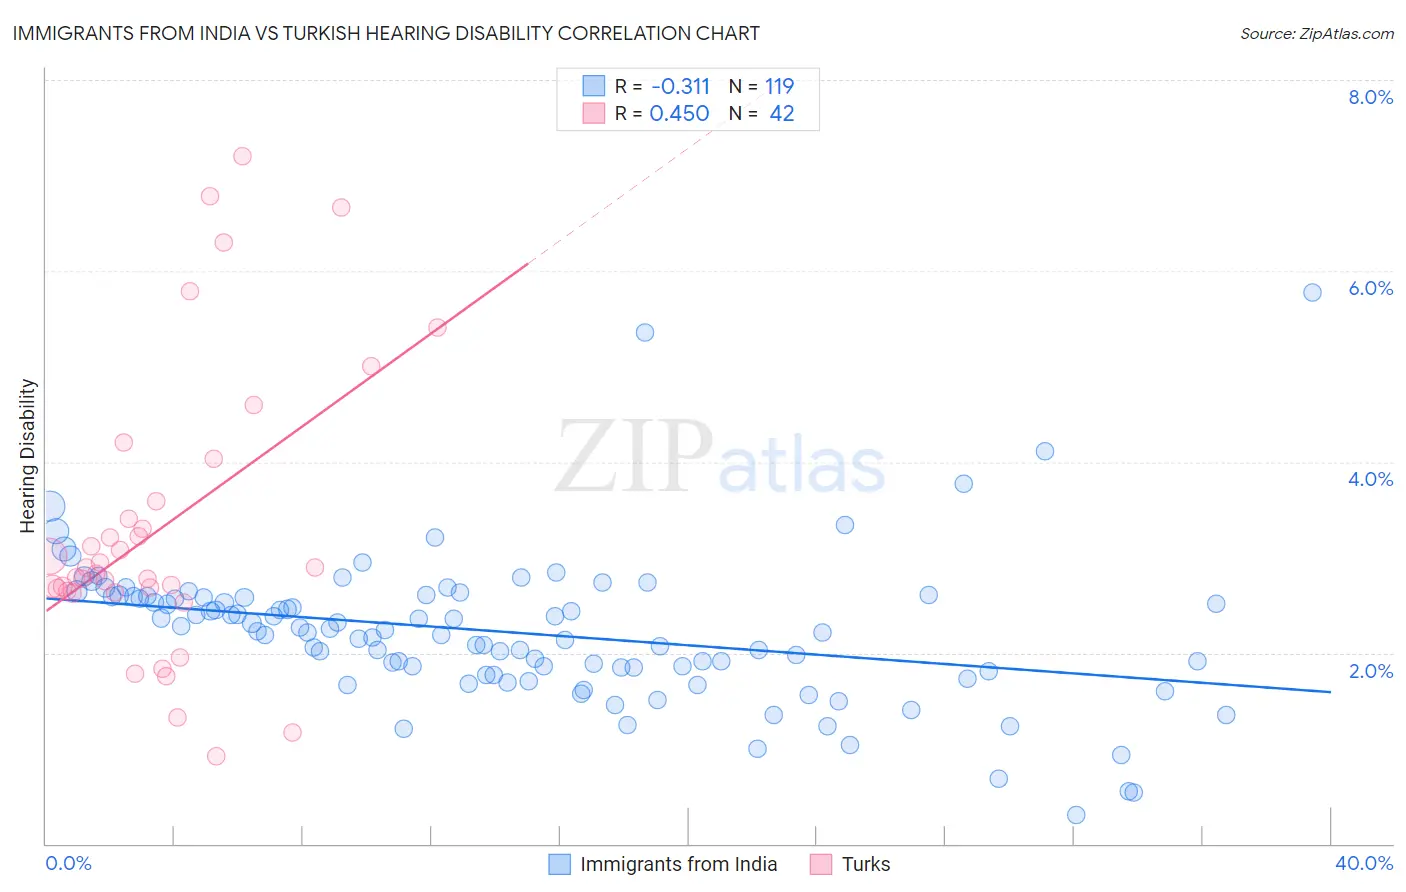
Immigrants from India vs Turkish Hearing Disability Correlation Chart
The statistical analysis conducted on geographies consisting of 433,914,336 people shows a mild negative correlation between the proportion of Immigrants from India and percentage of population with hearing disability in the United States with a correlation coefficient (R) of -0.311 and weighted average of 2.5%. Similarly, the statistical analysis conducted on geographies consisting of 271,814,668 people shows a moderate positive correlation between the proportion of Turks and percentage of population with hearing disability in the United States with a correlation coefficient (R) of 0.450 and weighted average of 2.8%, a difference of 11.3%.
Hearing Disability Correlation Summary
| Measurement | Immigrants from India | Turkish |
| Minimum | 0.30% | 0.92% |
| Maximum | 5.8% | 7.2% |
| Range | 5.5% | 6.3% |
| Mean | 2.2% | 3.3% |
| Median | 2.2% | 2.9% |
| Interquartile 25% (IQ1) | 1.8% | 2.7% |
| Interquartile 75% (IQ3) | 2.6% | 3.6% |
| Interquartile Range (IQR) | 0.78% | 0.93% |
| Standard Deviation (Sample) | 0.78% | 1.5% |
| Standard Deviation (Population) | 0.77% | 1.5% |
Similar Demographics by Hearing Disability
Demographics Similar to Immigrants from India by Hearing Disability
In terms of hearing disability, the demographic groups most similar to Immigrants from India are Immigrants from West Indies (2.5%, a difference of 0.32%), Barbadian (2.5%, a difference of 0.47%), Dominican (2.5%, a difference of 0.69%), Thai (2.5%, a difference of 0.72%), and Ecuadorian (2.5%, a difference of 0.77%).
| Demographics | Rating | Rank | Hearing Disability |
| Immigrants | Ecuador | 99.9 /100 | #10 | Exceptional 2.5% |
| Immigrants | Trinidad and Tobago | 99.9 /100 | #11 | Exceptional 2.5% |
| Trinidadians and Tobagonians | 99.9 /100 | #12 | Exceptional 2.5% |
| Sierra Leoneans | 99.9 /100 | #13 | Exceptional 2.5% |
| Ecuadorians | 99.9 /100 | #14 | Exceptional 2.5% |
| Barbadians | 99.9 /100 | #15 | Exceptional 2.5% |
| Immigrants | West Indies | 99.9 /100 | #16 | Exceptional 2.5% |
| Immigrants | India | 99.9 /100 | #17 | Exceptional 2.5% |
| Dominicans | 99.8 /100 | #18 | Exceptional 2.5% |
| Thais | 99.8 /100 | #19 | Exceptional 2.5% |
| Immigrants | Bolivia | 99.8 /100 | #20 | Exceptional 2.5% |
| Ghanaians | 99.8 /100 | #21 | Exceptional 2.5% |
| Immigrants | Sierra Leone | 99.8 /100 | #22 | Exceptional 2.6% |
| Immigrants | Nigeria | 99.8 /100 | #23 | Exceptional 2.6% |
| Immigrants | Ghana | 99.8 /100 | #24 | Exceptional 2.6% |
Demographics Similar to Turks by Hearing Disability
In terms of hearing disability, the demographic groups most similar to Turks are Cypriot (2.8%, a difference of 0.050%), Guatemalan (2.8%, a difference of 0.070%), Immigrants from Yemen (2.8%, a difference of 0.10%), Honduran (2.8%, a difference of 0.15%), and Immigrants from Chile (2.8%, a difference of 0.15%).
| Demographics | Rating | Rank | Hearing Disability |
| Taiwanese | 94.8 /100 | #102 | Exceptional 2.8% |
| Immigrants | Indonesia | 94.7 /100 | #103 | Exceptional 2.8% |
| Burmese | 94.2 /100 | #104 | Exceptional 2.8% |
| Moroccans | 93.9 /100 | #105 | Exceptional 2.8% |
| Hondurans | 93.4 /100 | #106 | Exceptional 2.8% |
| Immigrants | Chile | 93.4 /100 | #107 | Exceptional 2.8% |
| Guatemalans | 93.2 /100 | #108 | Exceptional 2.8% |
| Turks | 93.0 /100 | #109 | Exceptional 2.8% |
| Cypriots | 92.9 /100 | #110 | Exceptional 2.8% |
| Immigrants | Yemen | 92.7 /100 | #111 | Exceptional 2.8% |
| U.S. Virgin Islanders | 92.5 /100 | #112 | Exceptional 2.8% |
| Immigrants | Belarus | 91.6 /100 | #113 | Exceptional 2.8% |
| Cambodians | 91.1 /100 | #114 | Exceptional 2.8% |
| Immigrants | Latin America | 90.5 /100 | #115 | Exceptional 2.8% |
| Immigrants | Immigrants | 90.3 /100 | #116 | Exceptional 2.8% |