Immigrants from India vs Immigrants from Bahamas Vision Disability

COMPARE

Immigrants from India
Race
Ancestry
AfghanAfricanAlaska NativeAlaskan AthabascanAlbanianAleutAlsatianAmericanApacheArabArapahoArgentineanArmenianAssyrian/Chaldean/SyriacAustralianAustrianBahamianBangladeshiBarbadianBasqueBelgianBelizeanBermudanBhutaneseBlackfeetBolivianBrazilianBritishBritish West IndianBulgarianBurmeseCajunCambodianCanadianCape VerdeanCarpatho RusynCelticCentral AmericanCentral American IndianCherokeeCheyenneChickasawChileanChineseChippewaChoctawColombianColvilleComancheCosta RicanCreeCreekCroatianCrowCubanCypriotCzechCzechoslovakianDanishDelawareDominicanDutchDutch West IndianEastern EuropeanEcuadorianEgyptianEnglishEstonianEthiopianEuropeanFijianFilipinoFinnishFrenchFrench American IndianFrench CanadianGermanGerman RussianGhanaianGreekGuamanian/ChamorroGuatemalanGuyaneseHaitianHmongHonduranHopiHoumaHungarianIcelanderIndian (Asian)IndonesianInupiatIranianIraqiIrishIroquoisIsraeliItalianJamaicanJapaneseJordanianKenyanKiowaKoreanLaotianLatvianLebaneseLiberianLithuanianLumbeeLuxembourgerMacedonianMalaysianMalteseMarshalleseMenomineeMexicanMexican American IndianMongolianMoroccanNative HawaiianNavajoNepaleseNew ZealanderNicaraguanNigerianNorthern EuropeanNorwegianOkinawanOsageOttawaPaiutePakistaniPalestinianPanamanianParaguayanPennsylvania GermanPeruvianPimaPolishPortuguesePotawatomiPuebloPuerto RicanPuget Sound SalishRomanianRussianSalvadoranSamoanScandinavianScotch-IrishScottishSeminoleSenegaleseSerbianShoshoneSierra LeoneanSiouxSlavicSlovakSloveneSomaliSouth AfricanSouth AmericanSouth American IndianSoviet UnionSpaniardSpanishSpanish AmericanSpanish American IndianSri LankanSubsaharan AfricanSudaneseSwedishSwissSyrianTaiwaneseThaiTlingit-HaidaTohono O'OdhamTonganTrinidadian and TobagonianTsimshianTurkishU.S. Virgin IslanderUgandanUkrainianUruguayanUteVenezuelanVietnameseWelshWest IndianYakamaYaquiYugoslavianYumanYup'ikZimbabwean
Immigration
NonimmigrantsImmigrantsAfghanistanAfricaAlbaniaArgentinaArmeniaAsiaAustraliaAustriaBangladeshBarbadosBelarusBelgiumBelizeBoliviaBosnia and HerzegovinaBrazilBulgariaBurma/MyanmarCabo VerdeCambodiaCameroonCanadaCaribbeanCentral AmericaChileChinaColombiaCongoCosta RicaCroatiaCubaCzechoslovakiaDenmarkDominicaDominican RepublicEastern AfricaEastern AsiaEastern EuropeEcuadorEgyptEl SalvadorEnglandEritreaEthiopiaEuropeFijiFranceGermanyGhanaGreeceGrenadaGuatemalaGuyanaHaitiHondurasHong KongHungaryIndiaIndonesiaIranIraqIrelandIsraelItalyJamaicaJapanJordanKazakhstanKenyaKoreaKuwaitLaosLatin AmericaLatviaLebanonLiberiaLithuaniaMalaysiaMexicoMicronesiaMiddle AfricaMoldovaMoroccoNepalNetherlandsNicaraguaNigeriaNorth AmericaNorth MacedoniaNorthern AfricaNorthern EuropeNorwayOceaniaPakistanPanamaPeruPhilippinesPolandPortugalRomaniaRussiaSaudi ArabiaScotlandSenegalSerbiaSierra LeoneSingaporeSomaliaSouth AfricaSouth AmericaSouth Central AsiaSouth Eastern AsiaSouthern EuropeSpainSri LankaSt. Vincent and the GrenadinesSudanSwedenSwitzerlandSyriaTaiwanThailandTrinidad and TobagoTurkeyUgandaUkraineUruguayUzbekistanVenezuelaVietnamWest IndiesWestern AfricaWestern AsiaWestern EuropeYemenZaireZimbabweAzores
Immigrants from Bahamas
Race
Ancestry
AfghanAfricanAlaska NativeAlaskan AthabascanAlbanianAleutAlsatianAmericanApacheArabArapahoArgentineanArmenianAssyrian/Chaldean/SyriacAustralianAustrianBahamianBangladeshiBarbadianBasqueBelgianBelizeanBermudanBhutaneseBlackfeetBolivianBrazilianBritishBritish West IndianBulgarianBurmeseCajunCambodianCanadianCape VerdeanCarpatho RusynCelticCentral AmericanCentral American IndianCherokeeCheyenneChickasawChileanChineseChippewaChoctawColombianColvilleComancheCosta RicanCreeCreekCroatianCrowCubanCypriotCzechCzechoslovakianDanishDelawareDominicanDutchDutch West IndianEastern EuropeanEcuadorianEgyptianEnglishEstonianEthiopianEuropeanFijianFilipinoFinnishFrenchFrench American IndianFrench CanadianGermanGerman RussianGhanaianGreekGuamanian/ChamorroGuatemalanGuyaneseHaitianHmongHonduranHopiHoumaHungarianIcelanderIndian (Asian)IndonesianInupiatIranianIraqiIrishIroquoisIsraeliItalianJamaicanJapaneseJordanianKenyanKiowaKoreanLaotianLatvianLebaneseLiberianLithuanianLumbeeLuxembourgerMacedonianMalaysianMalteseMarshalleseMenomineeMexicanMexican American IndianMongolianMoroccanNative HawaiianNavajoNepaleseNew ZealanderNicaraguanNigerianNorthern EuropeanNorwegianOkinawanOsageOttawaPaiutePakistaniPalestinianPanamanianParaguayanPennsylvania GermanPeruvianPimaPolishPortuguesePotawatomiPuebloPuerto RicanPuget Sound SalishRomanianRussianSalvadoranSamoanScandinavianScotch-IrishScottishSeminoleSenegaleseSerbianShoshoneSierra LeoneanSiouxSlavicSlovakSloveneSomaliSouth AfricanSouth AmericanSouth American IndianSoviet UnionSpaniardSpanishSpanish AmericanSpanish American IndianSri LankanSubsaharan AfricanSudaneseSwedishSwissSyrianTaiwaneseThaiTlingit-HaidaTohono O'OdhamTonganTrinidadian and TobagonianTsimshianTurkishU.S. Virgin IslanderUgandanUkrainianUruguayanUteVenezuelanVietnameseWelshWest IndianYakamaYaquiYugoslavianYumanYup'ikZimbabwean
Immigration
NonimmigrantsImmigrantsAfghanistanAfricaAlbaniaArgentinaArmeniaAsiaAustraliaAustriaBahamasBangladeshBarbadosBelarusBelgiumBelizeBoliviaBosnia and HerzegovinaBrazilBulgariaBurma/MyanmarCabo VerdeCambodiaCameroonCanadaCaribbeanCentral AmericaChileChinaColombiaCongoCosta RicaCroatiaCubaCzechoslovakiaDenmarkDominicaDominican RepublicEastern AfricaEastern AsiaEastern EuropeEcuadorEgyptEl SalvadorEnglandEritreaEthiopiaEuropeFijiFranceGermanyGhanaGreeceGrenadaGuatemalaGuyanaHaitiHondurasHong KongHungaryIndonesiaIranIraqIrelandIsraelItalyJamaicaJapanJordanKazakhstanKenyaKoreaKuwaitLaosLatin AmericaLatviaLebanonLiberiaLithuaniaMalaysiaMexicoMicronesiaMiddle AfricaMoldovaMoroccoNepalNetherlandsNicaraguaNigeriaNorth AmericaNorth MacedoniaNorthern AfricaNorthern EuropeNorwayOceaniaPakistanPanamaPeruPhilippinesPolandPortugalRomaniaRussiaSaudi ArabiaScotlandSenegalSerbiaSierra LeoneSingaporeSomaliaSouth AfricaSouth AmericaSouth Central AsiaSouth Eastern AsiaSouthern EuropeSpainSri LankaSt. Vincent and the GrenadinesSudanSwedenSwitzerlandSyriaTaiwanThailandTrinidad and TobagoTurkeyUgandaUkraineUruguayUzbekistanVenezuelaVietnamWest IndiesWestern AfricaWestern AsiaWestern EuropeYemenZaireZimbabweAzores
Vision Disability
Income
Poverty
Unemployment
Labor Participation
Family Structure
Vehicle Availability
Education Level
Disability

Vision Disability Comparison

Immigrants from India

Immigrants from Bahamas

Exceptional
Tragic
1.7%
VISION DISABILITY
100.0/ 100
METRIC RATING
1st/ 347
METRIC RANK
2.4%
VISION DISABILITY
0.1/ 100
METRIC RATING
273rd/ 347
METRIC RANK

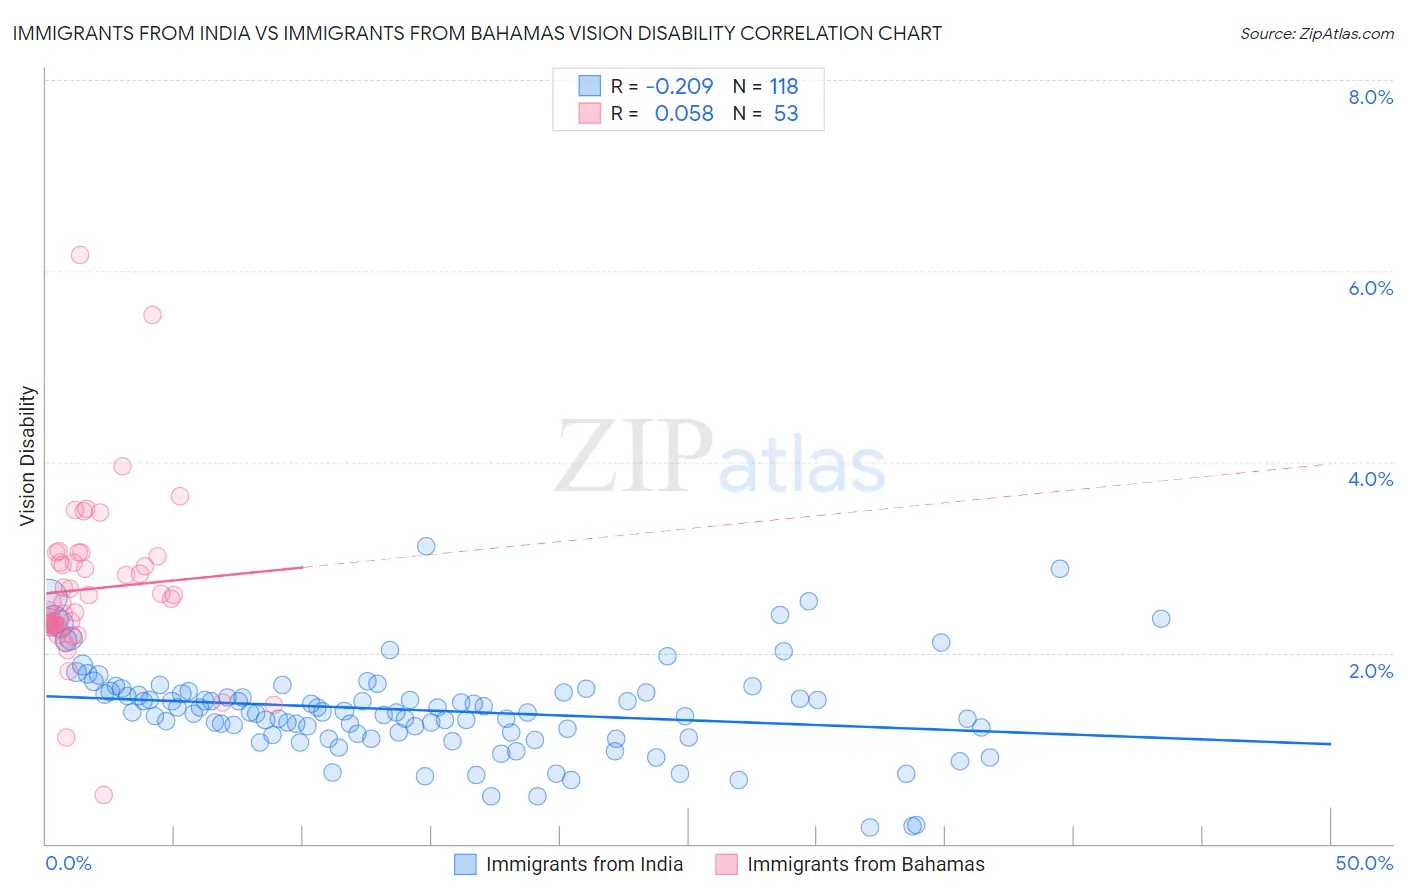
Immigrants from India vs Immigrants from Bahamas Vision Disability Correlation Chart

The statistical analysis conducted on geographies consisting of 433,750,609 people shows a weak negative correlation between the proportion of Immigrants from India and percentage of population with vision disability in the United States with a correlation coefficient (R) of -0.209 and weighted average of 1.7%. Similarly, the statistical analysis conducted on geographies consisting of 104,644,216 people shows a slight positive correlation between the proportion of Immigrants from Bahamas and percentage of population with vision disability in the United States with a correlation coefficient (R) of 0.058 and weighted average of 2.4%, a difference of 43.9%.
Immigrants from India vs Immigrants from Bahamas Vision Disability

Vision Disability Correlation Summary

MeasurementImmigrants from IndiaImmigrants from Bahamas
Minimum0.17%0.51%
Maximum3.1%6.2%
Range2.9%5.7%
Mean1.4%2.7%
Median1.4%2.5%
Interquartile 25% (IQ1)1.2%2.3%
Interquartile 75% (IQ3)1.6%3.0%
Interquartile Range (IQR)0.43%0.70%
Standard Deviation (Sample)0.49%0.89%
Standard Deviation (Population)0.49%0.88%

Similar Demographics by Vision Disability

Demographics Similar to Immigrants from India by Vision Disability

In terms of vision disability, the demographic groups most similar to Immigrants from India are Filipino (1.7%, a difference of 0.050%), Immigrants from Taiwan (1.7%, a difference of 0.71%), Thai (1.7%, a difference of 3.4%), Okinawan (1.8%, a difference of 5.3%), and Immigrants from Iran (1.8%, a difference of 6.0%).
DemographicsRating | RankVision Disability
Immigrants | India
100.0
/100
|
#1
Exceptional
1.7%
Filipinos
100.0
/100
|
#2
Exceptional
1.7%
Immigrants | Taiwan
100.0
/100
|
#3
Exceptional
1.7%
Thais
100.0
/100
|
#4
Exceptional
1.7%
Okinawans
100.0
/100
|
#5
Exceptional
1.8%
Immigrants | Iran
100.0
/100
|
#6
Exceptional
1.8%
Immigrants | South Central Asia
100.0
/100
|
#7
Exceptional
1.8%
Iranians
100.0
/100
|
#8
Exceptional
1.8%
Immigrants | Singapore
100.0
/100
|
#9
Exceptional
1.8%
Immigrants | Hong Kong
100.0
/100
|
#10
Exceptional
1.8%
Immigrants | Israel
100.0
/100
|
#11
Exceptional
1.8%
Immigrants | Korea
100.0
/100
|
#12
Exceptional
1.8%
Immigrants | Eastern Asia
100.0
/100
|
#13
Exceptional
1.8%
Immigrants | China
100.0
/100
|
#14
Exceptional
1.8%
Immigrants | Bolivia
100.0
/100
|
#15
Exceptional
1.8%

Demographics Similar to Immigrants from Bahamas by Vision Disability

In terms of vision disability, the demographic groups most similar to Immigrants from Bahamas are Immigrants from Latin America (2.4%, a difference of 0.31%), Spaniard (2.4%, a difference of 0.33%), Immigrants from the Azores (2.4%, a difference of 0.43%), Cuban (2.4%, a difference of 0.59%), and Celtic (2.4%, a difference of 0.60%).
DemographicsRating | RankVision Disability
Mexican American Indians
0.1
/100
|
#266
Tragic
2.4%
Ute
0.1
/100
|
#267
Tragic
2.4%
Senegalese
0.1
/100
|
#268
Tragic
2.4%
Celtics
0.1
/100
|
#269
Tragic
2.4%
Cubans
0.1
/100
|
#270
Tragic
2.4%
Immigrants | Azores
0.1
/100
|
#271
Tragic
2.4%
Spaniards
0.1
/100
|
#272
Tragic
2.4%
Immigrants | Bahamas
0.1
/100
|
#273
Tragic
2.4%
Immigrants | Latin America
0.0
/100
|
#274
Tragic
2.4%
Chippewa
0.0
/100
|
#275
Tragic
2.4%
Scotch-Irish
0.0
/100
|
#276
Tragic
2.4%
Bahamians
0.0
/100
|
#277
Tragic
2.4%
Spanish
0.0
/100
|
#278
Tragic
2.4%
Nepalese
0.0
/100
|
#279
Tragic
2.4%
Cape Verdeans
0.0
/100
|
#280
Tragic
2.4%