Immigrants from Guatemala vs Immigrants from Singapore Disability Age Over 75

COMPARE

Immigrants from Guatemala
Race
Ancestry
AfghanAfricanAlaska NativeAlaskan AthabascanAlbanianAleutAlsatianAmericanApacheArabArapahoArgentineanArmenianAssyrian/Chaldean/SyriacAustralianAustrianBahamianBangladeshiBarbadianBasqueBelgianBelizeanBermudanBhutaneseBlackfeetBolivianBrazilianBritishBritish West IndianBulgarianBurmeseCajunCambodianCanadianCape VerdeanCarpatho RusynCelticCentral AmericanCentral American IndianCherokeeCheyenneChickasawChileanChineseChippewaChoctawColombianColvilleComancheCosta RicanCreeCreekCroatianCrowCubanCypriotCzechCzechoslovakianDanishDelawareDominicanDutchDutch West IndianEastern EuropeanEcuadorianEgyptianEnglishEstonianEthiopianEuropeanFijianFilipinoFinnishFrenchFrench American IndianFrench CanadianGermanGerman RussianGhanaianGreekGuamanian/ChamorroGuatemalanGuyaneseHaitianHmongHonduranHopiHoumaHungarianIcelanderIndian (Asian)IndonesianInupiatIranianIraqiIrishIroquoisIsraeliItalianJamaicanJapaneseJordanianKenyanKiowaKoreanLaotianLatvianLebaneseLiberianLithuanianLumbeeLuxembourgerMacedonianMalaysianMalteseMarshalleseMenomineeMexicanMexican American IndianMongolianMoroccanNative HawaiianNavajoNepaleseNew ZealanderNicaraguanNigerianNorthern EuropeanNorwegianOkinawanOsageOttawaPaiutePakistaniPalestinianPanamanianParaguayanPennsylvania GermanPeruvianPimaPolishPortuguesePotawatomiPuebloPuerto RicanPuget Sound SalishRomanianRussianSalvadoranSamoanScandinavianScotch-IrishScottishSeminoleSenegaleseSerbianShoshoneSierra LeoneanSiouxSlavicSlovakSloveneSomaliSouth AfricanSouth AmericanSouth American IndianSoviet UnionSpaniardSpanishSpanish AmericanSpanish American IndianSri LankanSubsaharan AfricanSudaneseSwedishSwissSyrianTaiwaneseThaiTlingit-HaidaTohono O'OdhamTonganTrinidadian and TobagonianTsimshianTurkishU.S. Virgin IslanderUgandanUkrainianUruguayanUteVenezuelanVietnameseWelshWest IndianYakamaYaquiYugoslavianYumanYup'ikZimbabwean
Immigration
NonimmigrantsImmigrantsAfghanistanAfricaAlbaniaArgentinaArmeniaAsiaAustraliaAustriaBahamasBangladeshBarbadosBelarusBelgiumBelizeBoliviaBosnia and HerzegovinaBrazilBulgariaBurma/MyanmarCabo VerdeCambodiaCameroonCanadaCaribbeanCentral AmericaChileChinaColombiaCongoCosta RicaCroatiaCubaCzechoslovakiaDenmarkDominicaDominican RepublicEastern AfricaEastern AsiaEastern EuropeEcuadorEgyptEl SalvadorEnglandEritreaEthiopiaEuropeFijiFranceGermanyGhanaGreeceGrenadaGuatemalaGuyanaHaitiHondurasHong KongHungaryIndiaIndonesiaIranIraqIrelandIsraelItalyJamaicaJapanJordanKazakhstanKenyaKoreaKuwaitLaosLatin AmericaLatviaLebanonLiberiaLithuaniaMalaysiaMexicoMicronesiaMiddle AfricaMoldovaMoroccoNepalNetherlandsNicaraguaNigeriaNorth AmericaNorth MacedoniaNorthern AfricaNorthern EuropeNorwayOceaniaPakistanPanamaPeruPhilippinesPolandPortugalRomaniaRussiaSaudi ArabiaScotlandSenegalSerbiaSierra LeoneSomaliaSouth AfricaSouth AmericaSouth Central AsiaSouth Eastern AsiaSouthern EuropeSpainSri LankaSt. Vincent and the GrenadinesSudanSwedenSwitzerlandSyriaTaiwanThailandTrinidad and TobagoTurkeyUgandaUkraineUruguayUzbekistanVenezuelaVietnamWest IndiesWestern AfricaWestern AsiaWestern EuropeYemenZaireZimbabweAzores
Immigrants from Singapore
Race
Ancestry
AfghanAfricanAlaska NativeAlaskan AthabascanAlbanianAleutAlsatianAmericanApacheArabArapahoArgentineanArmenianAssyrian/Chaldean/SyriacAustralianAustrianBahamianBangladeshiBarbadianBasqueBelgianBelizeanBermudanBhutaneseBlackfeetBolivianBrazilianBritishBritish West IndianBulgarianBurmeseCajunCambodianCanadianCape VerdeanCarpatho RusynCelticCentral AmericanCentral American IndianCherokeeCheyenneChickasawChileanChineseChippewaChoctawColombianColvilleComancheCosta RicanCreeCreekCroatianCrowCubanCypriotCzechCzechoslovakianDanishDelawareDominicanDutchDutch West IndianEastern EuropeanEcuadorianEgyptianEnglishEstonianEthiopianEuropeanFijianFilipinoFinnishFrenchFrench American IndianFrench CanadianGermanGerman RussianGhanaianGreekGuamanian/ChamorroGuatemalanGuyaneseHaitianHmongHonduranHopiHoumaHungarianIcelanderIndian (Asian)IndonesianInupiatIranianIraqiIrishIroquoisIsraeliItalianJamaicanJapaneseJordanianKenyanKiowaKoreanLaotianLatvianLebaneseLiberianLithuanianLumbeeLuxembourgerMacedonianMalaysianMalteseMarshalleseMenomineeMexicanMexican American IndianMongolianMoroccanNative HawaiianNavajoNepaleseNew ZealanderNicaraguanNigerianNorthern EuropeanNorwegianOkinawanOsageOttawaPaiutePakistaniPalestinianPanamanianParaguayanPennsylvania GermanPeruvianPimaPolishPortuguesePotawatomiPuebloPuerto RicanPuget Sound SalishRomanianRussianSalvadoranSamoanScandinavianScotch-IrishScottishSeminoleSenegaleseSerbianShoshoneSierra LeoneanSiouxSlavicSlovakSloveneSomaliSouth AfricanSouth AmericanSouth American IndianSoviet UnionSpaniardSpanishSpanish AmericanSpanish American IndianSri LankanSubsaharan AfricanSudaneseSwedishSwissSyrianTaiwaneseThaiTlingit-HaidaTohono O'OdhamTonganTrinidadian and TobagonianTsimshianTurkishU.S. Virgin IslanderUgandanUkrainianUruguayanUteVenezuelanVietnameseWelshWest IndianYakamaYaquiYugoslavianYumanYup'ikZimbabwean
Immigration
NonimmigrantsImmigrantsAfghanistanAfricaAlbaniaArgentinaArmeniaAsiaAustraliaAustriaBahamasBangladeshBarbadosBelarusBelgiumBelizeBoliviaBosnia and HerzegovinaBrazilBulgariaBurma/MyanmarCabo VerdeCambodiaCameroonCanadaCaribbeanCentral AmericaChileChinaColombiaCongoCosta RicaCroatiaCubaCzechoslovakiaDenmarkDominicaDominican RepublicEastern AfricaEastern AsiaEastern EuropeEcuadorEgyptEl SalvadorEnglandEritreaEthiopiaEuropeFijiFranceGermanyGhanaGreeceGrenadaGuyanaHaitiHondurasHong KongHungaryIndiaIndonesiaIranIraqIrelandIsraelItalyJamaicaJapanJordanKazakhstanKenyaKoreaKuwaitLaosLatin AmericaLatviaLebanonLiberiaLithuaniaMalaysiaMexicoMicronesiaMiddle AfricaMoldovaMoroccoNepalNetherlandsNicaraguaNigeriaNorth AmericaNorth MacedoniaNorthern AfricaNorthern EuropeNorwayOceaniaPakistanPanamaPeruPhilippinesPolandPortugalRomaniaRussiaSaudi ArabiaScotlandSenegalSerbiaSierra LeoneSingaporeSomaliaSouth AfricaSouth AmericaSouth Central AsiaSouth Eastern AsiaSouthern EuropeSpainSri LankaSt. Vincent and the GrenadinesSudanSwedenSwitzerlandSyriaTaiwanThailandTrinidad and TobagoTurkeyUgandaUkraineUruguayUzbekistanVenezuelaVietnamWest IndiesWestern AfricaWestern AsiaWestern EuropeYemenZaireZimbabweAzores
Disability Age Over 75
Income
Poverty
Unemployment
Labor Participation
Family Structure
Vehicle Availability
Education Level
Disability

Disability Age Over 75 Comparison

Immigrants from Guatemala

Immigrants from Singapore

Tragic
Exceptional
49.1%
DISABILITY AGE OVER 75
0.1/ 100
METRIC RATING
274th/ 347
METRIC RANK
45.6%
DISABILITY AGE OVER 75
99.8/ 100
METRIC RATING
41st/ 347
METRIC RANK

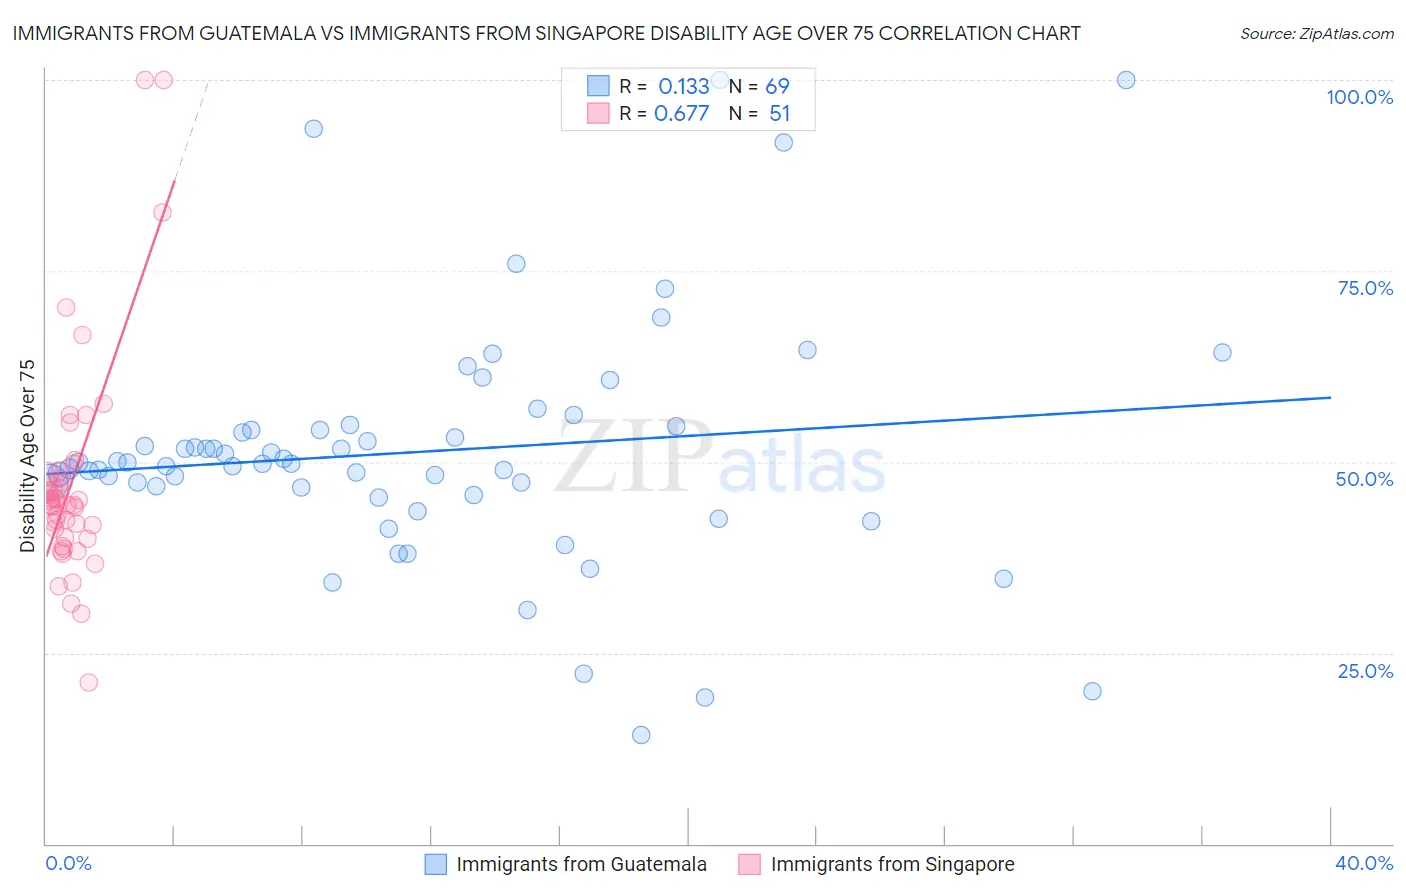
Immigrants from Guatemala vs Immigrants from Singapore Disability Age Over 75 Correlation Chart

The statistical analysis conducted on geographies consisting of 376,935,888 people shows a poor positive correlation between the proportion of Immigrants from Guatemala and percentage of population with a disability over the age of 75 in the United States with a correlation coefficient (R) of 0.133 and weighted average of 49.1%. Similarly, the statistical analysis conducted on geographies consisting of 137,364,760 people shows a significant positive correlation between the proportion of Immigrants from Singapore and percentage of population with a disability over the age of 75 in the United States with a correlation coefficient (R) of 0.677 and weighted average of 45.6%, a difference of 7.6%.
Immigrants from Guatemala vs Immigrants from Singapore Disability Age Over 75

Disability Age Over 75 Correlation Summary

MeasurementImmigrants from GuatemalaImmigrants from Singapore
Minimum14.3%21.2%
Maximum100.0%100.0%
Range85.7%78.8%
Mean51.3%47.3%
Median49.8%44.5%
Interquartile 25% (IQ1)46.1%40.1%
Interquartile 75% (IQ3)54.4%48.4%
Interquartile Range (IQR)8.3%8.3%
Standard Deviation (Sample)15.8%14.5%
Standard Deviation (Population)15.7%14.4%

Similar Demographics by Disability Age Over 75

Demographics Similar to Immigrants from Guatemala by Disability Age Over 75

In terms of disability age over 75, the demographic groups most similar to Immigrants from Guatemala are Immigrants from Dominica (49.1%, a difference of 0.010%), Immigrants from Iraq (49.1%, a difference of 0.070%), Assyrian/Chaldean/Syriac (49.1%, a difference of 0.13%), Immigrants from Uzbekistan (49.2%, a difference of 0.13%), and Fijian (49.0%, a difference of 0.14%).
DemographicsRating | RankDisability Age Over 75
Malaysians
0.2
/100
|
#267
Tragic
49.0%
Guatemalans
0.2
/100
|
#268
Tragic
49.0%
Immigrants | El Salvador
0.2
/100
|
#269
Tragic
49.0%
Potawatomi
0.2
/100
|
#270
Tragic
49.0%
Fijians
0.2
/100
|
#271
Tragic
49.0%
Assyrians/Chaldeans/Syriacs
0.2
/100
|
#272
Tragic
49.1%
Immigrants | Iraq
0.1
/100
|
#273
Tragic
49.1%
Immigrants | Guatemala
0.1
/100
|
#274
Tragic
49.1%
Immigrants | Dominica
0.1
/100
|
#275
Tragic
49.1%
Immigrants | Uzbekistan
0.1
/100
|
#276
Tragic
49.2%
Hawaiians
0.1
/100
|
#277
Tragic
49.2%
Immigrants | Laos
0.1
/100
|
#278
Tragic
49.2%
Guamanians/Chamorros
0.0
/100
|
#279
Tragic
49.4%
Bangladeshis
0.0
/100
|
#280
Tragic
49.4%
Belizeans
0.0
/100
|
#281
Tragic
49.4%

Demographics Similar to Immigrants from Singapore by Disability Age Over 75

In terms of disability age over 75, the demographic groups most similar to Immigrants from Singapore are Slovene (45.6%, a difference of 0.030%), Greek (45.6%, a difference of 0.040%), Czech (45.7%, a difference of 0.050%), Estonian (45.6%, a difference of 0.090%), and Australian (45.7%, a difference of 0.090%).
DemographicsRating | RankDisability Age Over 75
Russians
99.9
/100
|
#34
Exceptional
45.5%
Norwegians
99.9
/100
|
#35
Exceptional
45.5%
Immigrants | Taiwan
99.9
/100
|
#36
Exceptional
45.5%
South Africans
99.9
/100
|
#37
Exceptional
45.5%
Italians
99.9
/100
|
#38
Exceptional
45.6%
Estonians
99.9
/100
|
#39
Exceptional
45.6%
Slovenes
99.9
/100
|
#40
Exceptional
45.6%
Immigrants | Singapore
99.8
/100
|
#41
Exceptional
45.6%
Greeks
99.8
/100
|
#42
Exceptional
45.6%
Czechs
99.8
/100
|
#43
Exceptional
45.7%
Australians
99.8
/100
|
#44
Exceptional
45.7%
Turks
99.8
/100
|
#45
Exceptional
45.7%
Swedes
99.8
/100
|
#46
Exceptional
45.7%
Immigrants | Canada
99.8
/100
|
#47
Exceptional
45.7%
Croatians
99.8
/100
|
#48
Exceptional
45.7%