Immigrants from Guatemala vs Immigrants from Belgium Ambulatory Disability

COMPARE

Immigrants from Guatemala
Race
Ancestry
AfghanAfricanAlaska NativeAlaskan AthabascanAlbanianAleutAlsatianAmericanApacheArabArapahoArgentineanArmenianAssyrian/Chaldean/SyriacAustralianAustrianBahamianBangladeshiBarbadianBasqueBelgianBelizeanBermudanBhutaneseBlackfeetBolivianBrazilianBritishBritish West IndianBulgarianBurmeseCajunCambodianCanadianCape VerdeanCarpatho RusynCelticCentral AmericanCentral American IndianCherokeeCheyenneChickasawChileanChineseChippewaChoctawColombianColvilleComancheCosta RicanCreeCreekCroatianCrowCubanCypriotCzechCzechoslovakianDanishDelawareDominicanDutchDutch West IndianEastern EuropeanEcuadorianEgyptianEnglishEstonianEthiopianEuropeanFijianFilipinoFinnishFrenchFrench American IndianFrench CanadianGermanGerman RussianGhanaianGreekGuamanian/ChamorroGuatemalanGuyaneseHaitianHmongHonduranHopiHoumaHungarianIcelanderIndian (Asian)IndonesianInupiatIranianIraqiIrishIroquoisIsraeliItalianJamaicanJapaneseJordanianKenyanKiowaKoreanLaotianLatvianLebaneseLiberianLithuanianLumbeeLuxembourgerMacedonianMalaysianMalteseMarshalleseMenomineeMexicanMexican American IndianMongolianMoroccanNative HawaiianNavajoNepaleseNew ZealanderNicaraguanNigerianNorthern EuropeanNorwegianOkinawanOsageOttawaPaiutePakistaniPalestinianPanamanianParaguayanPennsylvania GermanPeruvianPimaPolishPortuguesePotawatomiPuebloPuerto RicanPuget Sound SalishRomanianRussianSalvadoranSamoanScandinavianScotch-IrishScottishSeminoleSenegaleseSerbianShoshoneSierra LeoneanSiouxSlavicSlovakSloveneSomaliSouth AfricanSouth AmericanSouth American IndianSoviet UnionSpaniardSpanishSpanish AmericanSpanish American IndianSri LankanSubsaharan AfricanSudaneseSwedishSwissSyrianTaiwaneseThaiTlingit-HaidaTohono O'OdhamTonganTrinidadian and TobagonianTsimshianTurkishU.S. Virgin IslanderUgandanUkrainianUruguayanUteVenezuelanVietnameseWelshWest IndianYakamaYaquiYugoslavianYumanYup'ikZimbabwean
Immigration
NonimmigrantsImmigrantsAfghanistanAfricaAlbaniaArgentinaArmeniaAsiaAustraliaAustriaBahamasBangladeshBarbadosBelarusBelizeBoliviaBosnia and HerzegovinaBrazilBulgariaBurma/MyanmarCabo VerdeCambodiaCameroonCanadaCaribbeanCentral AmericaChileChinaColombiaCongoCosta RicaCroatiaCubaCzechoslovakiaDenmarkDominicaDominican RepublicEastern AfricaEastern AsiaEastern EuropeEcuadorEgyptEl SalvadorEnglandEritreaEthiopiaEuropeFijiFranceGermanyGhanaGreeceGrenadaGuatemalaGuyanaHaitiHondurasHong KongHungaryIndiaIndonesiaIranIraqIrelandIsraelItalyJamaicaJapanJordanKazakhstanKenyaKoreaKuwaitLaosLatin AmericaLatviaLebanonLiberiaLithuaniaMalaysiaMexicoMicronesiaMiddle AfricaMoldovaMoroccoNepalNetherlandsNicaraguaNigeriaNorth AmericaNorth MacedoniaNorthern AfricaNorthern EuropeNorwayOceaniaPakistanPanamaPeruPhilippinesPolandPortugalRomaniaRussiaSaudi ArabiaScotlandSenegalSerbiaSierra LeoneSingaporeSomaliaSouth AfricaSouth AmericaSouth Central AsiaSouth Eastern AsiaSouthern EuropeSpainSri LankaSt. Vincent and the GrenadinesSudanSwedenSwitzerlandSyriaTaiwanThailandTrinidad and TobagoTurkeyUgandaUkraineUruguayUzbekistanVenezuelaVietnamWest IndiesWestern AfricaWestern AsiaWestern EuropeYemenZaireZimbabweAzores
Immigrants from Belgium
Race
Ancestry
AfghanAfricanAlaska NativeAlaskan AthabascanAlbanianAleutAlsatianAmericanApacheArabArapahoArgentineanArmenianAssyrian/Chaldean/SyriacAustralianAustrianBahamianBangladeshiBarbadianBasqueBelgianBelizeanBermudanBhutaneseBlackfeetBolivianBrazilianBritishBritish West IndianBulgarianBurmeseCajunCambodianCanadianCape VerdeanCarpatho RusynCelticCentral AmericanCentral American IndianCherokeeCheyenneChickasawChileanChineseChippewaChoctawColombianColvilleComancheCosta RicanCreeCreekCroatianCrowCubanCypriotCzechCzechoslovakianDanishDelawareDominicanDutchDutch West IndianEastern EuropeanEcuadorianEgyptianEnglishEstonianEthiopianEuropeanFijianFilipinoFinnishFrenchFrench American IndianFrench CanadianGermanGerman RussianGhanaianGreekGuamanian/ChamorroGuatemalanGuyaneseHaitianHmongHonduranHopiHoumaHungarianIcelanderIndian (Asian)IndonesianInupiatIranianIraqiIrishIroquoisIsraeliItalianJamaicanJapaneseJordanianKenyanKiowaKoreanLaotianLatvianLebaneseLiberianLithuanianLumbeeLuxembourgerMacedonianMalaysianMalteseMarshalleseMenomineeMexicanMexican American IndianMongolianMoroccanNative HawaiianNavajoNepaleseNew ZealanderNicaraguanNigerianNorthern EuropeanNorwegianOkinawanOsageOttawaPaiutePakistaniPalestinianPanamanianParaguayanPennsylvania GermanPeruvianPimaPolishPortuguesePotawatomiPuebloPuerto RicanPuget Sound SalishRomanianRussianSalvadoranSamoanScandinavianScotch-IrishScottishSeminoleSenegaleseSerbianShoshoneSierra LeoneanSiouxSlavicSlovakSloveneSomaliSouth AfricanSouth AmericanSouth American IndianSoviet UnionSpaniardSpanishSpanish AmericanSpanish American IndianSri LankanSubsaharan AfricanSudaneseSwedishSwissSyrianTaiwaneseThaiTlingit-HaidaTohono O'OdhamTonganTrinidadian and TobagonianTsimshianTurkishU.S. Virgin IslanderUgandanUkrainianUruguayanUteVenezuelanVietnameseWelshWest IndianYakamaYaquiYugoslavianYumanYup'ikZimbabwean
Immigration
NonimmigrantsImmigrantsAfghanistanAfricaAlbaniaArgentinaArmeniaAsiaAustraliaAustriaBahamasBangladeshBarbadosBelarusBelgiumBelizeBoliviaBosnia and HerzegovinaBrazilBulgariaBurma/MyanmarCabo VerdeCambodiaCameroonCanadaCaribbeanCentral AmericaChileChinaColombiaCongoCosta RicaCroatiaCubaCzechoslovakiaDenmarkDominicaDominican RepublicEastern AfricaEastern AsiaEastern EuropeEcuadorEgyptEl SalvadorEnglandEritreaEthiopiaEuropeFijiFranceGermanyGhanaGreeceGrenadaGuyanaHaitiHondurasHong KongHungaryIndiaIndonesiaIranIraqIrelandIsraelItalyJamaicaJapanJordanKazakhstanKenyaKoreaKuwaitLaosLatin AmericaLatviaLebanonLiberiaLithuaniaMalaysiaMexicoMicronesiaMiddle AfricaMoldovaMoroccoNepalNetherlandsNicaraguaNigeriaNorth AmericaNorth MacedoniaNorthern AfricaNorthern EuropeNorwayOceaniaPakistanPanamaPeruPhilippinesPolandPortugalRomaniaRussiaSaudi ArabiaScotlandSenegalSerbiaSierra LeoneSingaporeSomaliaSouth AfricaSouth AmericaSouth Central AsiaSouth Eastern AsiaSouthern EuropeSpainSri LankaSt. Vincent and the GrenadinesSudanSwedenSwitzerlandSyriaTaiwanThailandTrinidad and TobagoTurkeyUgandaUkraineUruguayUzbekistanVenezuelaVietnamWest IndiesWestern AfricaWestern AsiaWestern EuropeYemenZaireZimbabweAzores
Ambulatory Disability
Income
Poverty
Unemployment
Labor Participation
Family Structure
Vehicle Availability
Education Level
Disability

Ambulatory Disability Comparison

Immigrants from Guatemala

Immigrants from Belgium

Fair
Exceptional
6.2%
AMBULATORY DISABILITY
31.9/ 100
METRIC RATING
191st/ 347
METRIC RANK
5.6%
AMBULATORY DISABILITY
99.7/ 100
METRIC RATING
61st/ 347
METRIC RANK

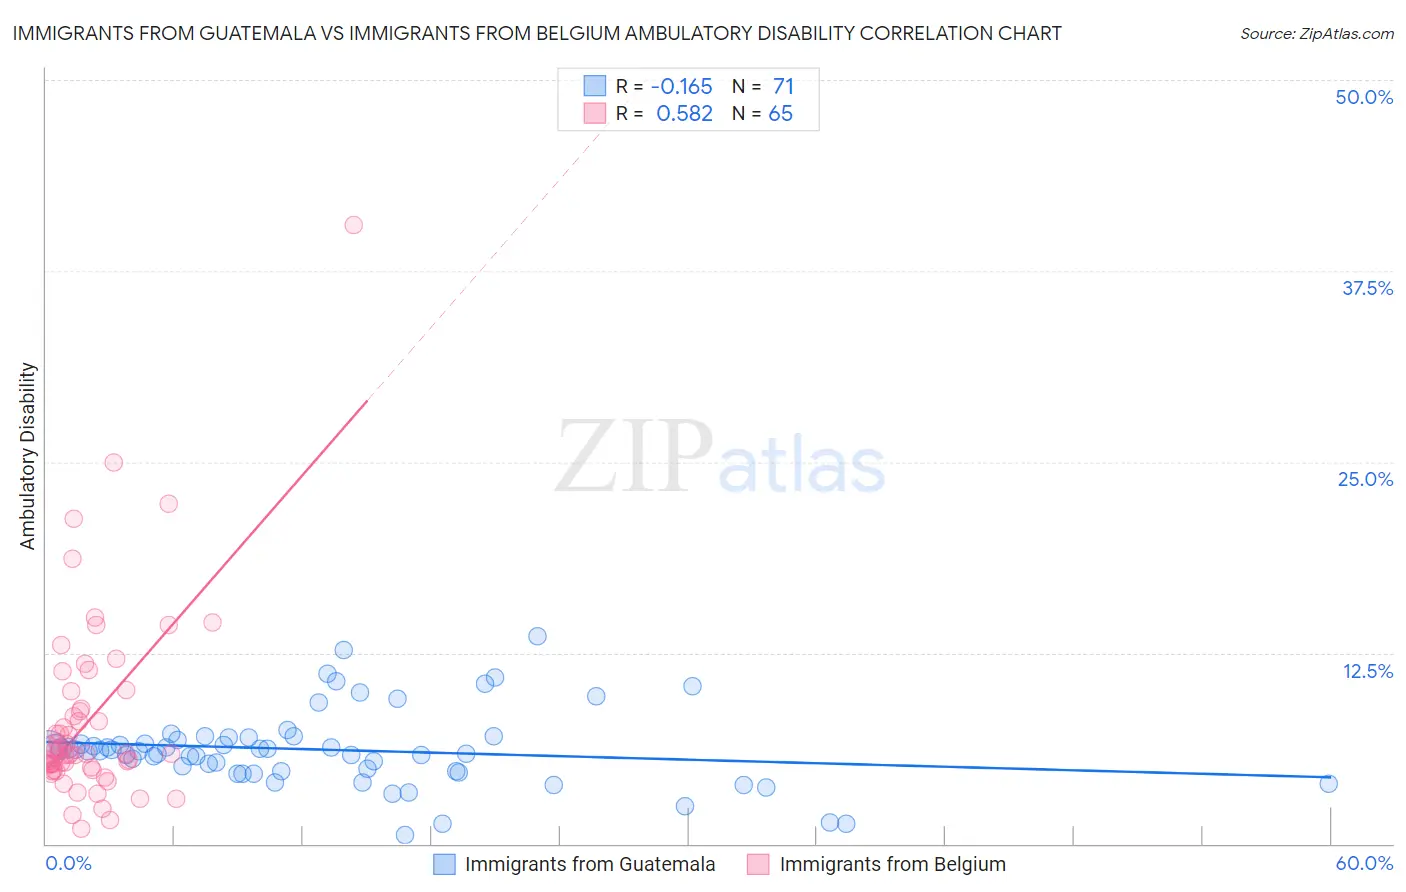
Immigrants from Guatemala vs Immigrants from Belgium Ambulatory Disability Correlation Chart

The statistical analysis conducted on geographies consisting of 377,192,086 people shows a poor negative correlation between the proportion of Immigrants from Guatemala and percentage of population with ambulatory disability in the United States with a correlation coefficient (R) of -0.165 and weighted average of 6.2%. Similarly, the statistical analysis conducted on geographies consisting of 146,707,151 people shows a substantial positive correlation between the proportion of Immigrants from Belgium and percentage of population with ambulatory disability in the United States with a correlation coefficient (R) of 0.582 and weighted average of 5.6%, a difference of 9.6%.
Immigrants from Guatemala vs Immigrants from Belgium Ambulatory Disability

Ambulatory Disability Correlation Summary

MeasurementImmigrants from GuatemalaImmigrants from Belgium
Minimum0.59%0.96%
Maximum13.5%40.5%
Range13.0%39.5%
Mean6.2%8.1%
Median6.1%5.9%
Interquartile 25% (IQ1)4.7%4.9%
Interquartile 75% (IQ3)7.0%9.4%
Interquartile Range (IQR)2.2%4.5%
Standard Deviation (Sample)2.5%6.3%
Standard Deviation (Population)2.5%6.3%

Similar Demographics by Ambulatory Disability

Demographics Similar to Immigrants from Guatemala by Ambulatory Disability

In terms of ambulatory disability, the demographic groups most similar to Immigrants from Guatemala are Immigrants from Western Europe (6.2%, a difference of 0.020%), Immigrants from Western Africa (6.2%, a difference of 0.090%), Ukrainian (6.2%, a difference of 0.12%), Guatemalan (6.2%, a difference of 0.12%), and Alaska Native (6.2%, a difference of 0.13%).
DemographicsRating | RankAmbulatory Disability
Immigrants | Ghana
41.2
/100
|
#184
Average
6.1%
Immigrants | Bosnia and Herzegovina
37.2
/100
|
#185
Fair
6.2%
Europeans
36.2
/100
|
#186
Fair
6.2%
Carpatho Rusyns
35.3
/100
|
#187
Fair
6.2%
British
34.3
/100
|
#188
Fair
6.2%
Ukrainians
34.0
/100
|
#189
Fair
6.2%
Immigrants | Western Africa
33.4
/100
|
#190
Fair
6.2%
Immigrants | Guatemala
31.9
/100
|
#191
Fair
6.2%
Immigrants | Western Europe
31.6
/100
|
#192
Fair
6.2%
Guatemalans
30.0
/100
|
#193
Fair
6.2%
Alaska Natives
29.8
/100
|
#194
Fair
6.2%
Belgians
28.6
/100
|
#195
Fair
6.2%
Malaysians
28.2
/100
|
#196
Fair
6.2%
Poles
26.3
/100
|
#197
Fair
6.2%
Immigrants | Bangladesh
24.6
/100
|
#198
Fair
6.2%

Demographics Similar to Immigrants from Belgium by Ambulatory Disability

In terms of ambulatory disability, the demographic groups most similar to Immigrants from Belgium are Immigrants from Spain (5.6%, a difference of 0.010%), Immigrants from Lithuania (5.6%, a difference of 0.12%), Immigrants from France (5.6%, a difference of 0.13%), Immigrants from Afghanistan (5.6%, a difference of 0.16%), and Immigrants from Zimbabwe (5.6%, a difference of 0.20%).
DemographicsRating | RankAmbulatory Disability
Immigrants | Eastern Africa
99.8
/100
|
#54
Exceptional
5.6%
Immigrants | Bulgaria
99.8
/100
|
#55
Exceptional
5.6%
Inupiat
99.8
/100
|
#56
Exceptional
5.6%
Immigrants | Brazil
99.8
/100
|
#57
Exceptional
5.6%
Immigrants | Zimbabwe
99.8
/100
|
#58
Exceptional
5.6%
Immigrants | Afghanistan
99.8
/100
|
#59
Exceptional
5.6%
Immigrants | Lithuania
99.8
/100
|
#60
Exceptional
5.6%
Immigrants | Belgium
99.7
/100
|
#61
Exceptional
5.6%
Immigrants | Spain
99.7
/100
|
#62
Exceptional
5.6%
Immigrants | France
99.7
/100
|
#63
Exceptional
5.6%
Laotians
99.7
/100
|
#64
Exceptional
5.7%
Immigrants | Switzerland
99.7
/100
|
#65
Exceptional
5.7%
Israelis
99.6
/100
|
#66
Exceptional
5.7%
Immigrants | Uganda
99.6
/100
|
#67
Exceptional
5.7%
Sri Lankans
99.6
/100
|
#68
Exceptional
5.7%