Immigrants from Greece vs Vietnamese Ambulatory Disability

COMPARE

Immigrants from Greece
Race
Ancestry
AfghanAfricanAlaska NativeAlaskan AthabascanAlbanianAleutAlsatianAmericanApacheArabArapahoArgentineanArmenianAssyrian/Chaldean/SyriacAustralianAustrianBahamianBangladeshiBarbadianBasqueBelgianBelizeanBermudanBhutaneseBlackfeetBolivianBrazilianBritishBritish West IndianBulgarianBurmeseCajunCambodianCanadianCape VerdeanCarpatho RusynCelticCentral AmericanCentral American IndianCherokeeCheyenneChickasawChileanChineseChippewaChoctawColombianColvilleComancheCosta RicanCreeCreekCroatianCrowCubanCypriotCzechCzechoslovakianDanishDelawareDominicanDutchDutch West IndianEastern EuropeanEcuadorianEgyptianEnglishEstonianEthiopianEuropeanFijianFilipinoFinnishFrenchFrench American IndianFrench CanadianGermanGerman RussianGhanaianGreekGuamanian/ChamorroGuatemalanGuyaneseHaitianHmongHonduranHopiHoumaHungarianIcelanderIndian (Asian)IndonesianInupiatIranianIraqiIrishIroquoisIsraeliItalianJamaicanJapaneseJordanianKenyanKiowaKoreanLaotianLatvianLebaneseLiberianLithuanianLumbeeLuxembourgerMacedonianMalaysianMalteseMarshalleseMenomineeMexicanMexican American IndianMongolianMoroccanNative HawaiianNavajoNepaleseNew ZealanderNicaraguanNigerianNorthern EuropeanNorwegianOkinawanOsageOttawaPaiutePakistaniPalestinianPanamanianParaguayanPennsylvania GermanPeruvianPimaPolishPortuguesePotawatomiPuebloPuerto RicanPuget Sound SalishRomanianRussianSalvadoranSamoanScandinavianScotch-IrishScottishSeminoleSenegaleseSerbianShoshoneSierra LeoneanSiouxSlavicSlovakSloveneSomaliSouth AfricanSouth AmericanSouth American IndianSoviet UnionSpaniardSpanishSpanish AmericanSpanish American IndianSri LankanSubsaharan AfricanSudaneseSwedishSwissSyrianTaiwaneseThaiTlingit-HaidaTohono O'OdhamTonganTrinidadian and TobagonianTsimshianTurkishU.S. Virgin IslanderUgandanUkrainianUruguayanUteVenezuelanWelshWest IndianYakamaYaquiYugoslavianYumanYup'ikZimbabwean
Immigration
NonimmigrantsImmigrantsAfghanistanAfricaAlbaniaArgentinaArmeniaAsiaAustraliaAustriaBahamasBangladeshBarbadosBelarusBelgiumBelizeBoliviaBosnia and HerzegovinaBrazilBulgariaBurma/MyanmarCabo VerdeCambodiaCameroonCanadaCaribbeanCentral AmericaChileChinaColombiaCongoCosta RicaCroatiaCubaCzechoslovakiaDenmarkDominicaDominican RepublicEastern AfricaEastern AsiaEastern EuropeEcuadorEgyptEl SalvadorEnglandEritreaEthiopiaEuropeFijiFranceGermanyGhanaGreeceGrenadaGuatemalaGuyanaHaitiHondurasHong KongHungaryIndiaIndonesiaIranIraqIrelandIsraelItalyJamaicaJapanJordanKazakhstanKenyaKoreaKuwaitLaosLatin AmericaLatviaLebanonLiberiaLithuaniaMalaysiaMexicoMicronesiaMiddle AfricaMoldovaMoroccoNepalNetherlandsNicaraguaNigeriaNorth AmericaNorth MacedoniaNorthern AfricaNorthern EuropeNorwayOceaniaPakistanPanamaPeruPhilippinesPolandPortugalRomaniaRussiaSaudi ArabiaScotlandSenegalSerbiaSierra LeoneSingaporeSomaliaSouth AfricaSouth AmericaSouth Central AsiaSouth Eastern AsiaSouthern EuropeSpainSri LankaSt. Vincent and the GrenadinesSudanSwedenSwitzerlandSyriaTaiwanThailandTrinidad and TobagoTurkeyUgandaUkraineUruguayUzbekistanVenezuelaVietnamWest IndiesWestern AfricaWestern AsiaWestern EuropeYemenZaireZimbabweAzores
Vietnamese
Race
Ancestry
AfghanAfricanAlaska NativeAlaskan AthabascanAlbanianAleutAlsatianAmericanApacheArabArapahoArgentineanArmenianAssyrian/Chaldean/SyriacAustralianAustrianBahamianBangladeshiBarbadianBasqueBelgianBelizeanBermudanBhutaneseBlackfeetBolivianBrazilianBritishBritish West IndianBulgarianBurmeseCajunCambodianCanadianCape VerdeanCarpatho RusynCelticCentral AmericanCentral American IndianCherokeeCheyenneChickasawChileanChineseChippewaChoctawColombianColvilleComancheCosta RicanCreeCreekCroatianCrowCubanCypriotCzechCzechoslovakianDanishDelawareDominicanDutchDutch West IndianEastern EuropeanEcuadorianEgyptianEnglishEstonianEthiopianEuropeanFijianFilipinoFinnishFrenchFrench American IndianFrench CanadianGermanGerman RussianGhanaianGreekGuamanian/ChamorroGuatemalanGuyaneseHaitianHmongHonduranHopiHoumaHungarianIcelanderIndian (Asian)IndonesianInupiatIranianIraqiIrishIroquoisIsraeliItalianJamaicanJapaneseJordanianKenyanKiowaKoreanLaotianLatvianLebaneseLiberianLithuanianLumbeeLuxembourgerMacedonianMalaysianMalteseMarshalleseMenomineeMexicanMexican American IndianMongolianMoroccanNative HawaiianNavajoNepaleseNew ZealanderNicaraguanNigerianNorthern EuropeanNorwegianOkinawanOsageOttawaPaiutePakistaniPalestinianPanamanianParaguayanPennsylvania GermanPeruvianPimaPolishPortuguesePotawatomiPuebloPuerto RicanPuget Sound SalishRomanianRussianSalvadoranSamoanScandinavianScotch-IrishScottishSeminoleSenegaleseSerbianShoshoneSierra LeoneanSiouxSlavicSlovakSloveneSomaliSouth AfricanSouth AmericanSouth American IndianSoviet UnionSpaniardSpanishSpanish AmericanSpanish American IndianSri LankanSubsaharan AfricanSudaneseSwedishSwissSyrianTaiwaneseThaiTlingit-HaidaTohono O'OdhamTonganTrinidadian and TobagonianTsimshianTurkishU.S. Virgin IslanderUgandanUkrainianUruguayanUteVenezuelanVietnameseWelshWest IndianYakamaYaquiYugoslavianYumanYup'ikZimbabwean
Immigration
NonimmigrantsImmigrantsAfghanistanAfricaAlbaniaArgentinaArmeniaAsiaAustraliaAustriaBahamasBangladeshBarbadosBelarusBelgiumBelizeBoliviaBosnia and HerzegovinaBrazilBulgariaBurma/MyanmarCabo VerdeCambodiaCameroonCanadaCaribbeanCentral AmericaChileChinaColombiaCongoCosta RicaCroatiaCubaCzechoslovakiaDenmarkDominicaDominican RepublicEastern AfricaEastern AsiaEastern EuropeEcuadorEgyptEl SalvadorEnglandEritreaEthiopiaEuropeFijiFranceGermanyGhanaGrenadaGuatemalaGuyanaHaitiHondurasHong KongHungaryIndiaIndonesiaIranIraqIrelandIsraelItalyJamaicaJapanJordanKazakhstanKenyaKoreaKuwaitLaosLatin AmericaLatviaLebanonLiberiaLithuaniaMalaysiaMexicoMicronesiaMiddle AfricaMoldovaMoroccoNepalNetherlandsNicaraguaNigeriaNorth AmericaNorth MacedoniaNorthern AfricaNorthern EuropeNorwayOceaniaPakistanPanamaPeruPhilippinesPolandPortugalRomaniaRussiaSaudi ArabiaScotlandSenegalSerbiaSierra LeoneSingaporeSomaliaSouth AfricaSouth AmericaSouth Central AsiaSouth Eastern AsiaSouthern EuropeSpainSri LankaSt. Vincent and the GrenadinesSudanSwedenSwitzerlandSyriaTaiwanThailandTrinidad and TobagoTurkeyUgandaUkraineUruguayUzbekistanVenezuelaVietnamWest IndiesWestern AfricaWestern AsiaWestern EuropeYemenZaireZimbabweAzores
Ambulatory Disability
Income
Poverty
Unemployment
Labor Participation
Family Structure
Vehicle Availability
Education Level
Disability

Ambulatory Disability Comparison

Immigrants from Greece

Vietnamese

Excellent
Average
6.0%
AMBULATORY DISABILITY
82.5/ 100
METRIC RATING
146th/ 347
METRIC RANK
6.1%
AMBULATORY DISABILITY
47.2/ 100
METRIC RATING
175th/ 347
METRIC RANK

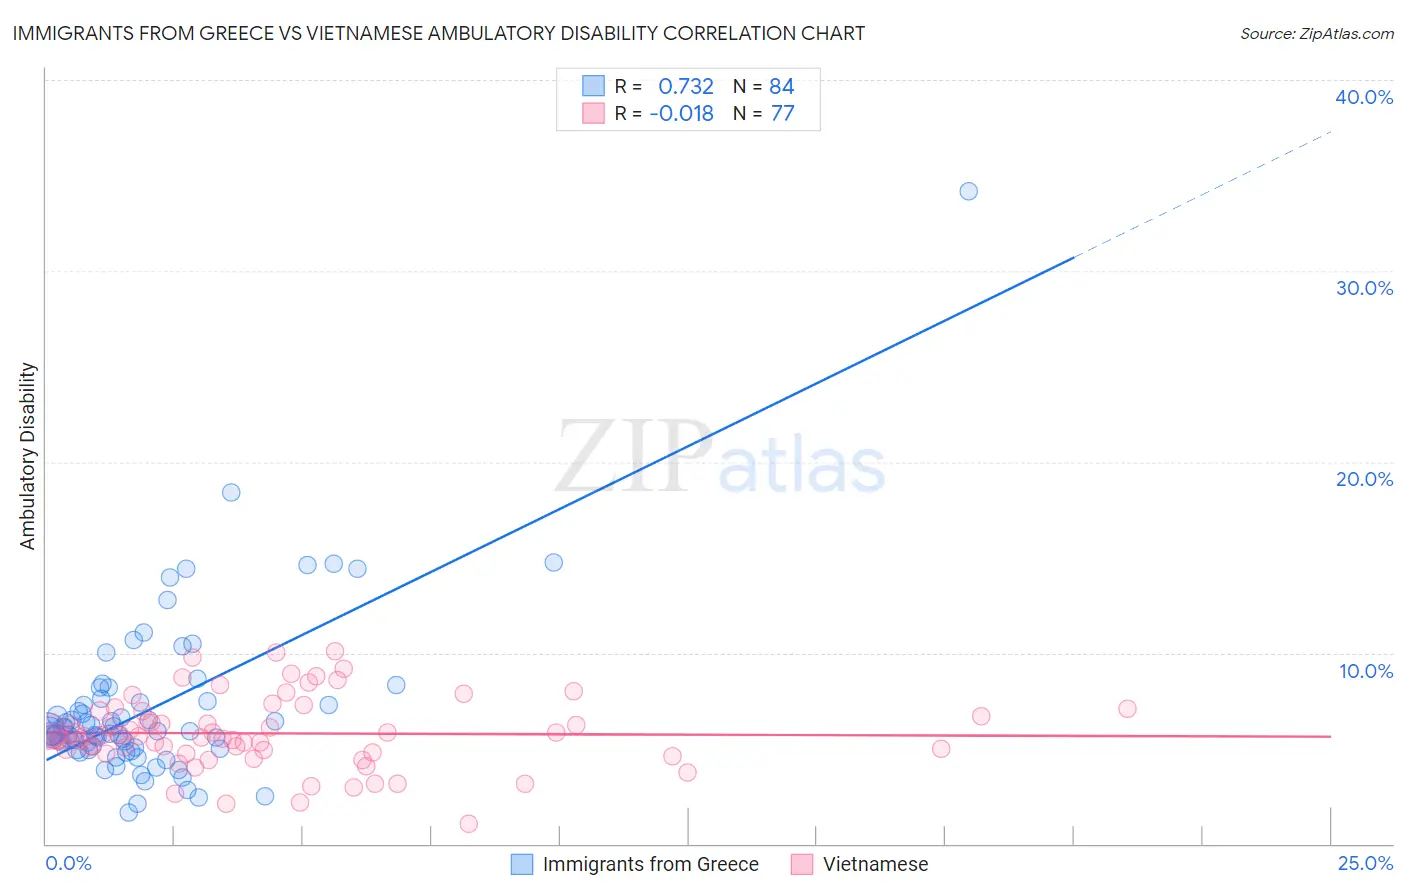
Immigrants from Greece vs Vietnamese Ambulatory Disability Correlation Chart

The statistical analysis conducted on geographies consisting of 216,870,944 people shows a strong positive correlation between the proportion of Immigrants from Greece and percentage of population with ambulatory disability in the United States with a correlation coefficient (R) of 0.732 and weighted average of 6.0%. Similarly, the statistical analysis conducted on geographies consisting of 170,721,676 people shows no correlation between the proportion of Vietnamese and percentage of population with ambulatory disability in the United States with a correlation coefficient (R) of -0.018 and weighted average of 6.1%, a difference of 2.2%.
Immigrants from Greece vs Vietnamese Ambulatory Disability

Ambulatory Disability Correlation Summary

MeasurementImmigrants from GreeceVietnamese
Minimum1.7%1.1%
Maximum34.2%10.1%
Range32.5%9.0%
Mean7.1%5.8%
Median5.8%5.6%
Interquartile 25% (IQ1)5.0%4.7%
Interquartile 75% (IQ3)7.4%6.9%
Interquartile Range (IQR)2.4%2.2%
Standard Deviation (Sample)4.4%1.9%
Standard Deviation (Population)4.4%1.9%

Similar Demographics by Ambulatory Disability

Demographics Similar to Immigrants from Greece by Ambulatory Disability

In terms of ambulatory disability, the demographic groups most similar to Immigrants from Greece are Pakistani (6.0%, a difference of 0.0%), Immigrants from Moldova (6.0%, a difference of 0.010%), Macedonian (6.0%, a difference of 0.030%), Romanian (6.0%, a difference of 0.040%), and Immigrants from Philippines (6.0%, a difference of 0.050%).
DemographicsRating | RankAmbulatory Disability
Immigrants | Zaire
83.6
/100
|
#139
Excellent
6.0%
Czechs
83.3
/100
|
#140
Excellent
6.0%
Swedes
83.1
/100
|
#141
Excellent
6.0%
Immigrants | Philippines
83.0
/100
|
#142
Excellent
6.0%
Romanians
82.9
/100
|
#143
Excellent
6.0%
Macedonians
82.8
/100
|
#144
Excellent
6.0%
Pakistanis
82.5
/100
|
#145
Excellent
6.0%
Immigrants | Greece
82.5
/100
|
#146
Excellent
6.0%
Immigrants | Moldova
82.4
/100
|
#147
Excellent
6.0%
Immigrants | Eastern Europe
82.0
/100
|
#148
Excellent
6.0%
Lithuanians
81.9
/100
|
#149
Excellent
6.0%
Maltese
81.6
/100
|
#150
Excellent
6.0%
Greeks
79.6
/100
|
#151
Good
6.0%
Immigrants | Austria
78.8
/100
|
#152
Good
6.0%
Syrians
75.5
/100
|
#153
Good
6.0%

Demographics Similar to Vietnamese by Ambulatory Disability

In terms of ambulatory disability, the demographic groups most similar to Vietnamese are Immigrants from North America (6.1%, a difference of 0.090%), Immigrants from England (6.1%, a difference of 0.10%), Scandinavian (6.1%, a difference of 0.14%), Immigrants from Canada (6.1%, a difference of 0.15%), and Austrian (6.1%, a difference of 0.17%).
DemographicsRating | RankAmbulatory Disability
Ecuadorians
60.5
/100
|
#168
Good
6.1%
Immigrants | Southern Europe
58.1
/100
|
#169
Average
6.1%
Immigrants | Ecuador
53.8
/100
|
#170
Average
6.1%
Moroccans
52.6
/100
|
#171
Average
6.1%
Immigrants | Burma/Myanmar
52.2
/100
|
#172
Average
6.1%
Croatians
51.2
/100
|
#173
Average
6.1%
Immigrants | Canada
50.0
/100
|
#174
Average
6.1%
Vietnamese
47.2
/100
|
#175
Average
6.1%
Immigrants | North America
45.6
/100
|
#176
Average
6.1%
Immigrants | England
45.4
/100
|
#177
Average
6.1%
Scandinavians
44.5
/100
|
#178
Average
6.1%
Austrians
44.1
/100
|
#179
Average
6.1%
Immigrants | Nicaragua
43.9
/100
|
#180
Average
6.1%
Swiss
43.1
/100
|
#181
Average
6.1%
Serbians
42.8
/100
|
#182
Average
6.1%