Immigrants from Greece vs Immigrants from Kazakhstan Hearing Disability
COMPARE
Immigrants from Greece
Immigrants from Kazakhstan
Hearing Disability
Hearing Disability Comparison
Immigrants from Greece
Immigrants from Kazakhstan
3.0%
HEARING DISABILITY
57.9/ 100
METRIC RATING
168th/ 347
METRIC RANK
2.9%
HEARING DISABILITY
69.6/ 100
METRIC RATING
157th/ 347
METRIC RANK
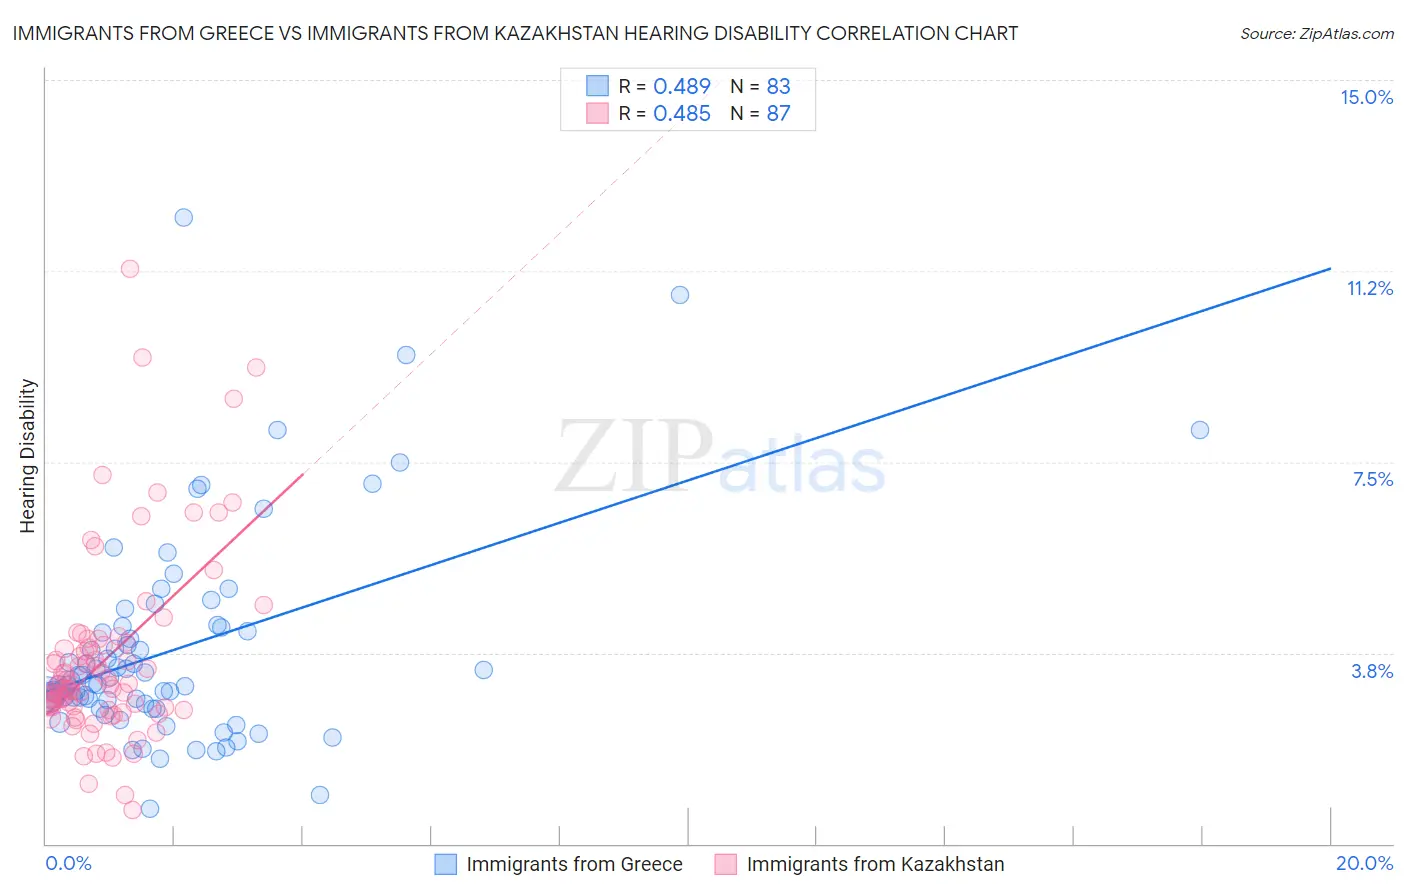
Immigrants from Greece vs Immigrants from Kazakhstan Hearing Disability Correlation Chart
The statistical analysis conducted on geographies consisting of 216,842,518 people shows a moderate positive correlation between the proportion of Immigrants from Greece and percentage of population with hearing disability in the United States with a correlation coefficient (R) of 0.489 and weighted average of 3.0%. Similarly, the statistical analysis conducted on geographies consisting of 124,435,235 people shows a moderate positive correlation between the proportion of Immigrants from Kazakhstan and percentage of population with hearing disability in the United States with a correlation coefficient (R) of 0.485 and weighted average of 2.9%, a difference of 1.2%.
Hearing Disability Correlation Summary
| Measurement | Immigrants from Greece | Immigrants from Kazakhstan |
| Minimum | 0.70% | 0.67% |
| Maximum | 12.3% | 11.3% |
| Range | 11.6% | 10.6% |
| Mean | 3.8% | 3.6% |
| Median | 3.2% | 3.1% |
| Interquartile 25% (IQ1) | 2.8% | 2.6% |
| Interquartile 75% (IQ3) | 4.3% | 4.0% |
| Interquartile Range (IQR) | 1.5% | 1.3% |
| Standard Deviation (Sample) | 2.1% | 1.9% |
| Standard Deviation (Population) | 2.0% | 1.9% |
Demographics Similar to Immigrants from Greece and Immigrants from Kazakhstan by Hearing Disability
In terms of hearing disability, the demographic groups most similar to Immigrants from Greece are Immigrants from Eastern Europe (3.0%, a difference of 0.020%), Arab (3.0%, a difference of 0.030%), Immigrants from Cabo Verde (3.0%, a difference of 0.10%), Immigrants from Ukraine (3.0%, a difference of 0.12%), and Armenian (3.0%, a difference of 0.18%). Similarly, the demographic groups most similar to Immigrants from Kazakhstan are Immigrants from Burma/Myanmar (2.9%, a difference of 0.010%), Immigrants from Poland (2.9%, a difference of 0.070%), Costa Rican (2.9%, a difference of 0.21%), Immigrants from Lebanon (2.9%, a difference of 0.22%), and Immigrants from Australia (2.9%, a difference of 0.25%).
| Demographics | Rating | Rank | Hearing Disability |
| Immigrants | Lithuania | 73.0 /100 | #152 | Good 2.9% |
| Sudanese | 72.1 /100 | #153 | Good 2.9% |
| Immigrants | Lebanon | 71.5 /100 | #154 | Good 2.9% |
| Costa Ricans | 71.4 /100 | #155 | Good 2.9% |
| Immigrants | Poland | 70.2 /100 | #156 | Good 2.9% |
| Immigrants | Kazakhstan | 69.6 /100 | #157 | Good 2.9% |
| Immigrants | Burma/Myanmar | 69.5 /100 | #158 | Good 2.9% |
| Immigrants | Australia | 67.4 /100 | #159 | Good 2.9% |
| Immigrants | Fiji | 67.1 /100 | #160 | Good 2.9% |
| Albanians | 66.6 /100 | #161 | Good 2.9% |
| Immigrants | Japan | 66.3 /100 | #162 | Good 2.9% |
| Immigrants | Central America | 64.9 /100 | #163 | Good 3.0% |
| Immigrants | Cambodia | 64.8 /100 | #164 | Good 3.0% |
| Immigrants | Zimbabwe | 64.2 /100 | #165 | Good 3.0% |
| Immigrants | South Eastern Asia | 62.9 /100 | #166 | Good 3.0% |
| Immigrants | Eastern Europe | 58.1 /100 | #167 | Average 3.0% |
| Immigrants | Greece | 57.9 /100 | #168 | Average 3.0% |
| Arabs | 57.6 /100 | #169 | Average 3.0% |
| Immigrants | Cabo Verde | 56.9 /100 | #170 | Average 3.0% |
| Immigrants | Ukraine | 56.6 /100 | #171 | Average 3.0% |
| Armenians | 56.0 /100 | #172 | Average 3.0% |