Immigrants from Ghana vs Immigrants from Taiwan Cognitive Disability
COMPARE
Immigrants from Ghana
Immigrants from Taiwan
Cognitive Disability
Cognitive Disability Comparison
Immigrants from Ghana
Immigrants from Taiwan
18.3%
COGNITIVE DISABILITY
0.0/ 100
METRIC RATING
301st/ 347
METRIC RANK
15.7%
COGNITIVE DISABILITY
100.0/ 100
METRIC RATING
1st/ 347
METRIC RANK
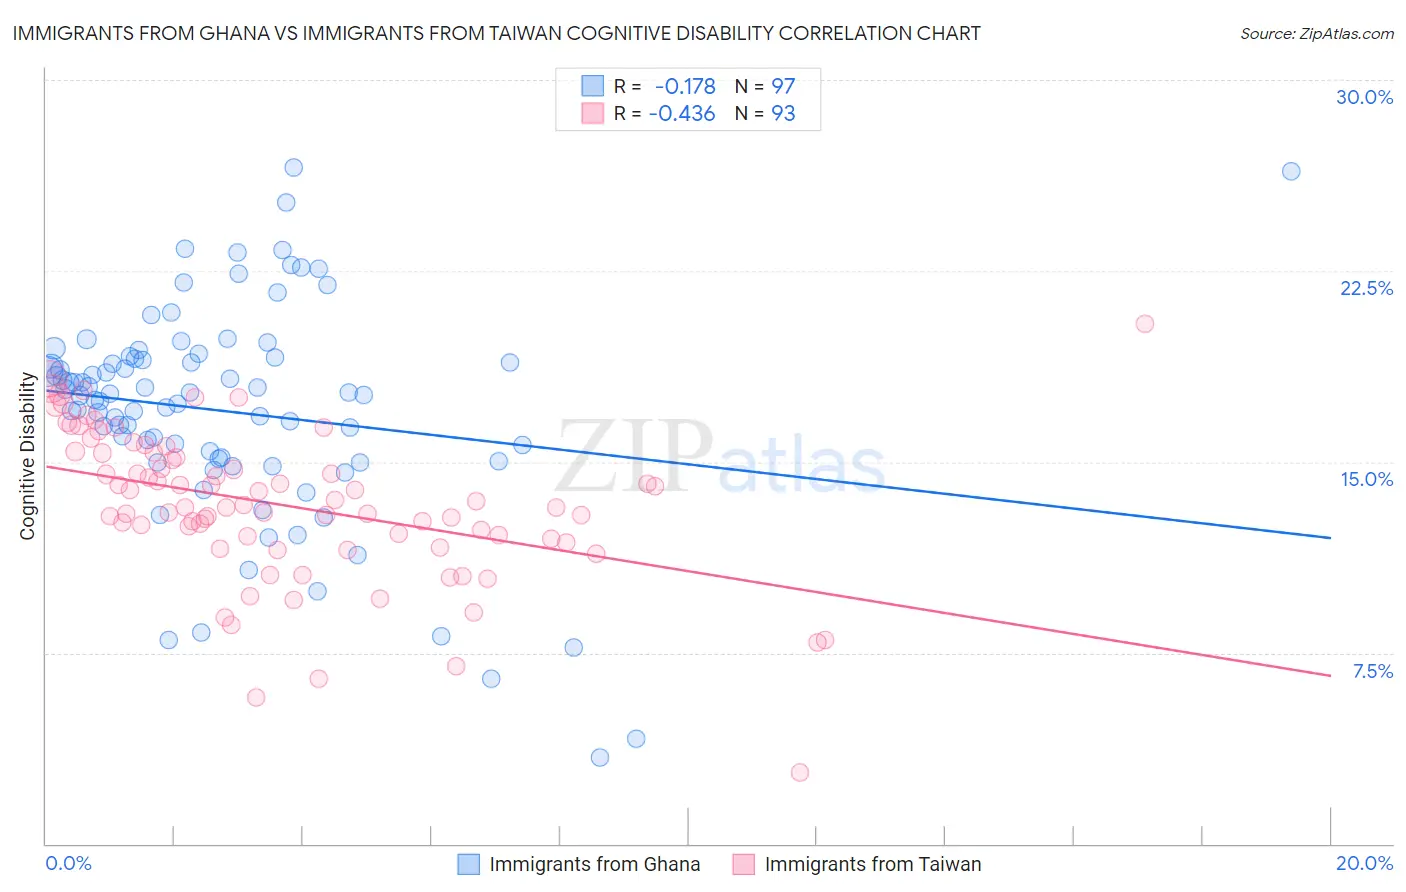
Immigrants from Ghana vs Immigrants from Taiwan Cognitive Disability Correlation Chart
The statistical analysis conducted on geographies consisting of 199,902,948 people shows a poor negative correlation between the proportion of Immigrants from Ghana and percentage of population with cognitive disability in the United States with a correlation coefficient (R) of -0.178 and weighted average of 18.3%. Similarly, the statistical analysis conducted on geographies consisting of 298,281,408 people shows a moderate negative correlation between the proportion of Immigrants from Taiwan and percentage of population with cognitive disability in the United States with a correlation coefficient (R) of -0.436 and weighted average of 15.7%, a difference of 16.4%.
Cognitive Disability Correlation Summary
| Measurement | Immigrants from Ghana | Immigrants from Taiwan |
| Minimum | 3.4% | 2.8% |
| Maximum | 26.6% | 20.4% |
| Range | 23.2% | 17.6% |
| Mean | 17.0% | 13.3% |
| Median | 17.6% | 13.2% |
| Interquartile 25% (IQ1) | 15.1% | 11.9% |
| Interquartile 75% (IQ3) | 19.1% | 15.4% |
| Interquartile Range (IQR) | 4.0% | 3.5% |
| Standard Deviation (Sample) | 4.3% | 3.0% |
| Standard Deviation (Population) | 4.3% | 3.0% |
Similar Demographics by Cognitive Disability
Demographics Similar to Immigrants from Ghana by Cognitive Disability
In terms of cognitive disability, the demographic groups most similar to Immigrants from Ghana are Barbadian (18.3%, a difference of 0.080%), Immigrants from Kenya (18.3%, a difference of 0.090%), Creek (18.3%, a difference of 0.14%), Immigrants from Eritrea (18.3%, a difference of 0.15%), and Ghanaian (18.3%, a difference of 0.17%).
| Demographics | Rating | Rank | Cognitive Disability |
| British West Indians | 0.1 /100 | #294 | Tragic 18.2% |
| German Russians | 0.0 /100 | #295 | Tragic 18.2% |
| Immigrants | Burma/Myanmar | 0.0 /100 | #296 | Tragic 18.2% |
| Blackfeet | 0.0 /100 | #297 | Tragic 18.3% |
| Japanese | 0.0 /100 | #298 | Tragic 18.3% |
| Ghanaians | 0.0 /100 | #299 | Tragic 18.3% |
| Creek | 0.0 /100 | #300 | Tragic 18.3% |
| Immigrants | Ghana | 0.0 /100 | #301 | Tragic 18.3% |
| Barbadians | 0.0 /100 | #302 | Tragic 18.3% |
| Immigrants | Kenya | 0.0 /100 | #303 | Tragic 18.3% |
| Immigrants | Eritrea | 0.0 /100 | #304 | Tragic 18.3% |
| Colville | 0.0 /100 | #305 | Tragic 18.3% |
| Seminole | 0.0 /100 | #306 | Tragic 18.3% |
| Ugandans | 0.0 /100 | #307 | Tragic 18.3% |
| Immigrants | Western Africa | 0.0 /100 | #308 | Tragic 18.4% |
Demographics Similar to Immigrants from Taiwan by Cognitive Disability
In terms of cognitive disability, the demographic groups most similar to Immigrants from Taiwan are Immigrants from India (15.9%, a difference of 1.3%), Chinese (15.9%, a difference of 1.3%), Immigrants from Lithuania (16.0%, a difference of 1.5%), Immigrants from Hong Kong (16.0%, a difference of 1.9%), and Thai (16.1%, a difference of 2.6%).
| Demographics | Rating | Rank | Cognitive Disability |
| Immigrants | Taiwan | 100.0 /100 | #1 | Exceptional 15.7% |
| Immigrants | India | 100.0 /100 | #2 | Exceptional 15.9% |
| Chinese | 100.0 /100 | #3 | Exceptional 15.9% |
| Immigrants | Lithuania | 100.0 /100 | #4 | Exceptional 16.0% |
| Immigrants | Hong Kong | 100.0 /100 | #5 | Exceptional 16.0% |
| Thais | 100.0 /100 | #6 | Exceptional 16.1% |
| Immigrants | Ireland | 100.0 /100 | #7 | Exceptional 16.1% |
| Immigrants | Poland | 100.0 /100 | #8 | Exceptional 16.1% |
| Assyrians/Chaldeans/Syriacs | 100.0 /100 | #9 | Exceptional 16.2% |
| Immigrants | Scotland | 100.0 /100 | #10 | Exceptional 16.2% |
| Immigrants | Czechoslovakia | 100.0 /100 | #11 | Exceptional 16.2% |
| Maltese | 100.0 /100 | #12 | Exceptional 16.2% |
| Lithuanians | 100.0 /100 | #13 | Exceptional 16.3% |
| Immigrants | Austria | 100.0 /100 | #14 | Exceptional 16.3% |
| Immigrants | Greece | 100.0 /100 | #15 | Exceptional 16.3% |