Immigrants from Germany vs Russian Disability Age 65 to 74

COMPARE

Immigrants from Germany
Race
Ancestry
AfghanAfricanAlaska NativeAlaskan AthabascanAlbanianAleutAlsatianAmericanApacheArabArapahoArgentineanArmenianAssyrian/Chaldean/SyriacAustralianAustrianBahamianBangladeshiBarbadianBasqueBelgianBelizeanBermudanBhutaneseBlackfeetBolivianBrazilianBritishBritish West IndianBulgarianBurmeseCajunCambodianCanadianCape VerdeanCarpatho RusynCelticCentral AmericanCentral American IndianCherokeeCheyenneChickasawChileanChineseChippewaChoctawColombianColvilleComancheCosta RicanCreeCreekCroatianCrowCubanCypriotCzechCzechoslovakianDanishDelawareDominicanDutchDutch West IndianEastern EuropeanEcuadorianEgyptianEnglishEstonianEthiopianEuropeanFijianFilipinoFinnishFrenchFrench American IndianFrench CanadianGermanGerman RussianGhanaianGreekGuamanian/ChamorroGuatemalanGuyaneseHaitianHmongHonduranHopiHoumaHungarianIcelanderIndian (Asian)IndonesianInupiatIranianIraqiIrishIroquoisIsraeliItalianJamaicanJapaneseJordanianKenyanKiowaKoreanLaotianLatvianLebaneseLiberianLithuanianLumbeeLuxembourgerMacedonianMalaysianMalteseMarshalleseMenomineeMexicanMexican American IndianMongolianMoroccanNative HawaiianNavajoNepaleseNew ZealanderNicaraguanNigerianNorthern EuropeanNorwegianOkinawanOsageOttawaPaiutePakistaniPalestinianPanamanianParaguayanPennsylvania GermanPeruvianPimaPolishPortuguesePotawatomiPuebloPuerto RicanPuget Sound SalishRomanianSalvadoranSamoanScandinavianScotch-IrishScottishSeminoleSenegaleseSerbianShoshoneSierra LeoneanSiouxSlavicSlovakSloveneSomaliSouth AfricanSouth AmericanSouth American IndianSoviet UnionSpaniardSpanishSpanish AmericanSpanish American IndianSri LankanSubsaharan AfricanSudaneseSwedishSwissSyrianTaiwaneseThaiTlingit-HaidaTohono O'OdhamTonganTrinidadian and TobagonianTsimshianTurkishU.S. Virgin IslanderUgandanUkrainianUruguayanUteVenezuelanVietnameseWelshWest IndianYakamaYaquiYugoslavianYumanYup'ikZimbabwean
Immigration
NonimmigrantsImmigrantsAfghanistanAfricaAlbaniaArgentinaArmeniaAsiaAustraliaAustriaBahamasBangladeshBarbadosBelarusBelgiumBelizeBoliviaBosnia and HerzegovinaBrazilBulgariaBurma/MyanmarCabo VerdeCambodiaCameroonCanadaCaribbeanCentral AmericaChileChinaColombiaCongoCosta RicaCroatiaCubaCzechoslovakiaDenmarkDominicaDominican RepublicEastern AfricaEastern AsiaEastern EuropeEcuadorEgyptEl SalvadorEnglandEritreaEthiopiaEuropeFijiFranceGermanyGhanaGreeceGrenadaGuatemalaGuyanaHaitiHondurasHong KongHungaryIndiaIndonesiaIranIraqIrelandIsraelItalyJamaicaJapanJordanKazakhstanKenyaKoreaKuwaitLaosLatin AmericaLatviaLebanonLiberiaLithuaniaMalaysiaMexicoMicronesiaMiddle AfricaMoldovaMoroccoNepalNetherlandsNicaraguaNigeriaNorth AmericaNorth MacedoniaNorthern AfricaNorthern EuropeNorwayOceaniaPakistanPanamaPeruPhilippinesPolandPortugalRomaniaRussiaSaudi ArabiaScotlandSenegalSerbiaSierra LeoneSingaporeSomaliaSouth AfricaSouth AmericaSouth Central AsiaSouth Eastern AsiaSouthern EuropeSpainSri LankaSt. Vincent and the GrenadinesSudanSwedenSwitzerlandSyriaTaiwanThailandTrinidad and TobagoTurkeyUgandaUkraineUruguayUzbekistanVenezuelaVietnamWest IndiesWestern AfricaWestern AsiaWestern EuropeYemenZaireZimbabweAzores
Russian
Race
Ancestry
AfghanAfricanAlaska NativeAlaskan AthabascanAlbanianAleutAlsatianAmericanApacheArabArapahoArgentineanArmenianAssyrian/Chaldean/SyriacAustralianAustrianBahamianBangladeshiBarbadianBasqueBelgianBelizeanBermudanBhutaneseBlackfeetBolivianBrazilianBritishBritish West IndianBulgarianBurmeseCajunCambodianCanadianCape VerdeanCarpatho RusynCelticCentral AmericanCentral American IndianCherokeeCheyenneChickasawChileanChineseChippewaChoctawColombianColvilleComancheCosta RicanCreeCreekCroatianCrowCubanCypriotCzechCzechoslovakianDanishDelawareDominicanDutchDutch West IndianEastern EuropeanEcuadorianEgyptianEnglishEstonianEthiopianEuropeanFijianFilipinoFinnishFrenchFrench American IndianFrench CanadianGermanGerman RussianGhanaianGreekGuamanian/ChamorroGuatemalanGuyaneseHaitianHmongHonduranHopiHoumaHungarianIcelanderIndian (Asian)IndonesianInupiatIranianIraqiIrishIroquoisIsraeliItalianJamaicanJapaneseJordanianKenyanKiowaKoreanLaotianLatvianLebaneseLiberianLithuanianLumbeeLuxembourgerMacedonianMalaysianMalteseMarshalleseMenomineeMexicanMexican American IndianMongolianMoroccanNative HawaiianNavajoNepaleseNew ZealanderNicaraguanNigerianNorthern EuropeanNorwegianOkinawanOsageOttawaPaiutePakistaniPalestinianPanamanianParaguayanPennsylvania GermanPeruvianPimaPolishPortuguesePotawatomiPuebloPuerto RicanPuget Sound SalishRomanianRussianSalvadoranSamoanScandinavianScotch-IrishScottishSeminoleSenegaleseSerbianShoshoneSierra LeoneanSiouxSlavicSlovakSloveneSomaliSouth AfricanSouth AmericanSouth American IndianSoviet UnionSpaniardSpanishSpanish AmericanSpanish American IndianSri LankanSubsaharan AfricanSudaneseSwedishSwissSyrianTaiwaneseThaiTlingit-HaidaTohono O'OdhamTonganTrinidadian and TobagonianTsimshianTurkishU.S. Virgin IslanderUgandanUkrainianUruguayanUteVenezuelanVietnameseWelshWest IndianYakamaYaquiYugoslavianYumanYup'ikZimbabwean
Immigration
NonimmigrantsImmigrantsAfghanistanAfricaAlbaniaArgentinaArmeniaAsiaAustraliaAustriaBahamasBangladeshBarbadosBelarusBelgiumBelizeBoliviaBosnia and HerzegovinaBrazilBulgariaBurma/MyanmarCabo VerdeCambodiaCameroonCanadaCaribbeanCentral AmericaChileChinaColombiaCongoCosta RicaCroatiaCubaCzechoslovakiaDenmarkDominicaDominican RepublicEastern AfricaEastern AsiaEastern EuropeEcuadorEgyptEl SalvadorEnglandEritreaEthiopiaEuropeFijiFranceGhanaGreeceGrenadaGuatemalaGuyanaHaitiHondurasHong KongHungaryIndiaIndonesiaIranIraqIrelandIsraelItalyJamaicaJapanJordanKazakhstanKenyaKoreaKuwaitLaosLatin AmericaLatviaLebanonLiberiaLithuaniaMalaysiaMexicoMicronesiaMiddle AfricaMoldovaMoroccoNepalNetherlandsNicaraguaNigeriaNorth AmericaNorth MacedoniaNorthern AfricaNorthern EuropeNorwayOceaniaPakistanPanamaPeruPhilippinesPolandPortugalRomaniaRussiaSaudi ArabiaScotlandSenegalSerbiaSierra LeoneSingaporeSomaliaSouth AfricaSouth AmericaSouth Central AsiaSouth Eastern AsiaSouthern EuropeSpainSri LankaSt. Vincent and the GrenadinesSudanSwedenSwitzerlandSyriaTaiwanThailandTrinidad and TobagoTurkeyUgandaUkraineUruguayUzbekistanVenezuelaVietnamWest IndiesWestern AfricaWestern AsiaWestern EuropeYemenZaireZimbabweAzores
Disability Age 65 to 74
Income
Poverty
Unemployment
Labor Participation
Family Structure
Vehicle Availability
Education Level
Disability

Disability Age 65 to 74 Comparison

Immigrants from Germany

Russians

Average
Exceptional
23.4%
DISABILITY AGE 65 TO 74
42.5/ 100
METRIC RATING
184th/ 347
METRIC RANK
21.2%
DISABILITY AGE 65 TO 74
99.8/ 100
METRIC RATING
38th/ 347
METRIC RANK

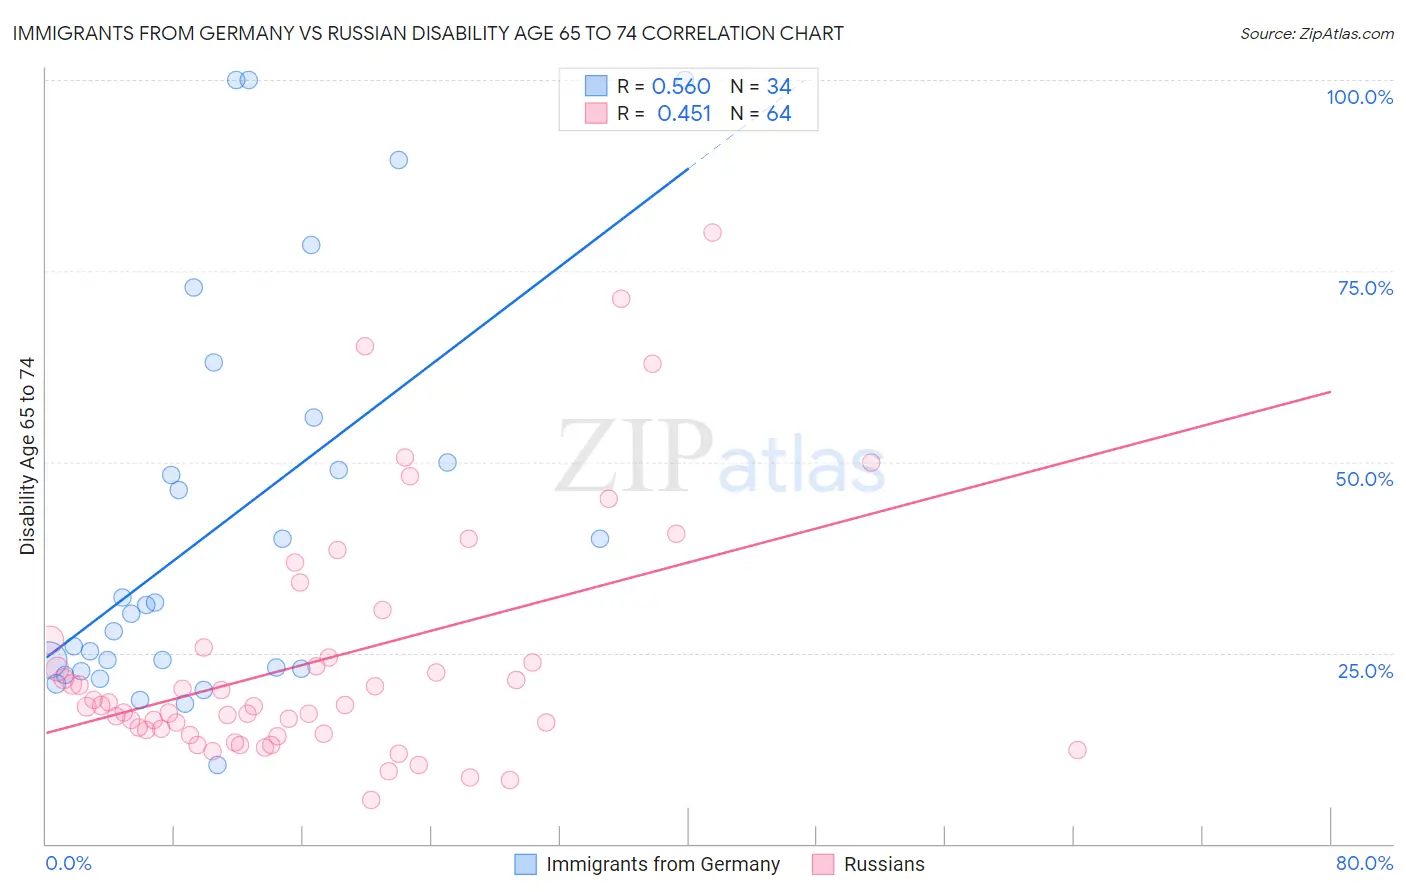
Immigrants from Germany vs Russian Disability Age 65 to 74 Correlation Chart

The statistical analysis conducted on geographies consisting of 463,135,745 people shows a substantial positive correlation between the proportion of Immigrants from Germany and percentage of population with a disability between the ages 65 and 75 in the United States with a correlation coefficient (R) of 0.560 and weighted average of 23.4%. Similarly, the statistical analysis conducted on geographies consisting of 510,598,178 people shows a moderate positive correlation between the proportion of Russians and percentage of population with a disability between the ages 65 and 75 in the United States with a correlation coefficient (R) of 0.451 and weighted average of 21.2%, a difference of 10.8%.
Immigrants from Germany vs Russian Disability Age 65 to 74

Disability Age 65 to 74 Correlation Summary

MeasurementImmigrants from GermanyRussian
Minimum10.4%5.7%
Maximum100.0%80.0%
Range89.6%74.3%
Mean41.5%23.9%
Median30.7%18.1%
Interquartile 25% (IQ1)22.9%14.7%
Interquartile 75% (IQ3)50.0%25.0%
Interquartile Range (IQR)27.1%10.4%
Standard Deviation (Sample)26.1%15.8%
Standard Deviation (Population)25.7%15.7%

Similar Demographics by Disability Age 65 to 74

Demographics Similar to Immigrants from Germany by Disability Age 65 to 74

In terms of disability age 65 to 74, the demographic groups most similar to Immigrants from Germany are Haitian (23.4%, a difference of 0.010%), Immigrants from Eastern Africa (23.4%, a difference of 0.020%), Irish (23.4%, a difference of 0.11%), Assyrian/Chaldean/Syriac (23.4%, a difference of 0.16%), and Scandinavian (23.4%, a difference of 0.18%).
DemographicsRating | RankDisability Age 65 to 74
Immigrants | Haiti
47.5
/100
|
#177
Average
23.4%
Guyanese
45.8
/100
|
#178
Average
23.4%
Immigrants | Sierra Leone
45.8
/100
|
#179
Average
23.4%
Scandinavians
45.6
/100
|
#180
Average
23.4%
Assyrians/Chaldeans/Syriacs
45.3
/100
|
#181
Average
23.4%
Irish
44.4
/100
|
#182
Average
23.4%
Immigrants | Eastern Africa
42.8
/100
|
#183
Average
23.4%
Immigrants | Germany
42.5
/100
|
#184
Average
23.4%
Haitians
42.4
/100
|
#185
Average
23.4%
Basques
38.4
/100
|
#186
Fair
23.5%
Portuguese
37.8
/100
|
#187
Fair
23.5%
Immigrants | Cuba
34.0
/100
|
#188
Fair
23.6%
Scottish
33.1
/100
|
#189
Fair
23.6%
Immigrants | Guyana
31.2
/100
|
#190
Fair
23.6%
Immigrants | Bangladesh
30.2
/100
|
#191
Fair
23.6%

Demographics Similar to Russians by Disability Age 65 to 74

In terms of disability age 65 to 74, the demographic groups most similar to Russians are Israeli (21.2%, a difference of 0.0%), Immigrants from Switzerland (21.1%, a difference of 0.11%), Argentinean (21.2%, a difference of 0.18%), Bulgarian (21.1%, a difference of 0.30%), and Latvian (21.2%, a difference of 0.35%).
DemographicsRating | RankDisability Age 65 to 74
Immigrants | Northern Europe
99.9
/100
|
#31
Exceptional
21.0%
Turks
99.9
/100
|
#32
Exceptional
21.0%
Immigrants | Argentina
99.9
/100
|
#33
Exceptional
21.1%
Immigrants | Sri Lanka
99.9
/100
|
#34
Exceptional
21.1%
Bulgarians
99.9
/100
|
#35
Exceptional
21.1%
Immigrants | Switzerland
99.8
/100
|
#36
Exceptional
21.1%
Israelis
99.8
/100
|
#37
Exceptional
21.2%
Russians
99.8
/100
|
#38
Exceptional
21.2%
Argentineans
99.8
/100
|
#39
Exceptional
21.2%
Latvians
99.8
/100
|
#40
Exceptional
21.2%
Immigrants | Austria
99.8
/100
|
#41
Exceptional
21.2%
Macedonians
99.7
/100
|
#42
Exceptional
21.3%
Immigrants | Croatia
99.7
/100
|
#43
Exceptional
21.3%
Estonians
99.7
/100
|
#44
Exceptional
21.4%
Asians
99.7
/100
|
#45
Exceptional
21.4%