Immigrants from Europe vs Trinidadian and Tobagonian Cognitive Disability
COMPARE
Immigrants from Europe
Trinidadian and Tobagonian
Cognitive Disability
Cognitive Disability Comparison
Immigrants from Europe
Trinidadians and Tobagonians
16.5%
COGNITIVE DISABILITY
99.8/ 100
METRIC RATING
45th/ 347
METRIC RANK
17.9%
COGNITIVE DISABILITY
0.8/ 100
METRIC RATING
245th/ 347
METRIC RANK
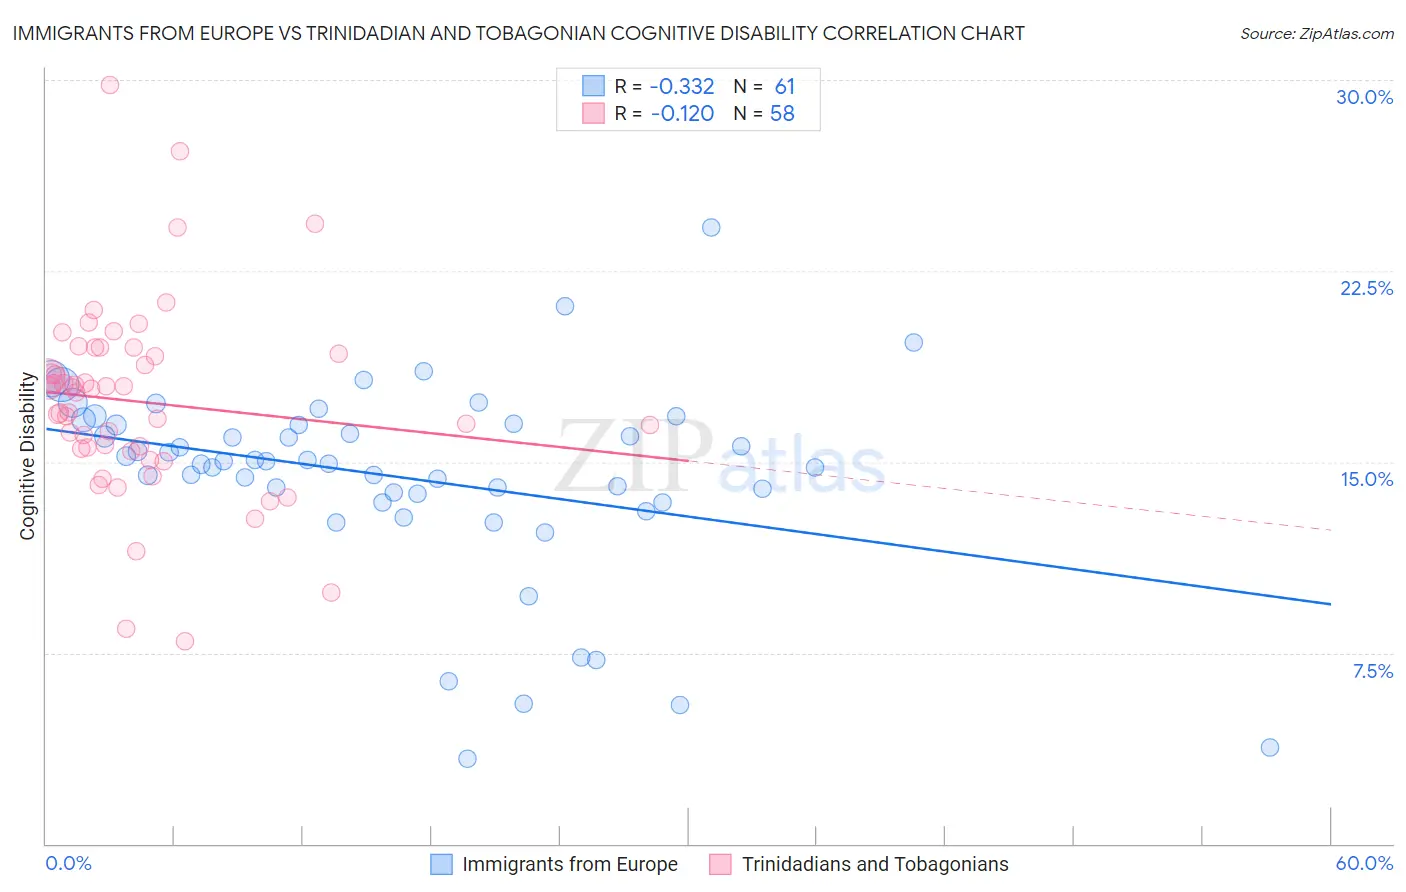
Immigrants from Europe vs Trinidadian and Tobagonian Cognitive Disability Correlation Chart
The statistical analysis conducted on geographies consisting of 547,313,932 people shows a mild negative correlation between the proportion of Immigrants from Europe and percentage of population with cognitive disability in the United States with a correlation coefficient (R) of -0.332 and weighted average of 16.5%. Similarly, the statistical analysis conducted on geographies consisting of 219,836,057 people shows a poor negative correlation between the proportion of Trinidadians and Tobagonians and percentage of population with cognitive disability in the United States with a correlation coefficient (R) of -0.120 and weighted average of 17.9%, a difference of 8.4%.
Cognitive Disability Correlation Summary
| Measurement | Immigrants from Europe | Trinidadian and Tobagonian |
| Minimum | 3.3% | 7.9% |
| Maximum | 24.2% | 29.8% |
| Range | 20.9% | 21.9% |
| Mean | 14.4% | 17.4% |
| Median | 15.0% | 17.8% |
| Interquartile 25% (IQ1) | 13.6% | 15.5% |
| Interquartile 75% (IQ3) | 16.5% | 19.2% |
| Interquartile Range (IQR) | 2.9% | 3.7% |
| Standard Deviation (Sample) | 3.9% | 3.8% |
| Standard Deviation (Population) | 3.9% | 3.8% |
Similar Demographics by Cognitive Disability
Demographics Similar to Immigrants from Europe by Cognitive Disability
In terms of cognitive disability, the demographic groups most similar to Immigrants from Europe are Macedonian (16.5%, a difference of 0.010%), Immigrants from Colombia (16.5%, a difference of 0.010%), Immigrants from Canada (16.5%, a difference of 0.030%), Immigrants from Italy (16.5%, a difference of 0.040%), and Immigrants from North America (16.5%, a difference of 0.040%).
| Demographics | Rating | Rank | Cognitive Disability |
| Immigrants | Eastern Europe | 99.9 /100 | #38 | Exceptional 16.5% |
| Bolivians | 99.9 /100 | #39 | Exceptional 16.5% |
| Immigrants | Belarus | 99.9 /100 | #40 | Exceptional 16.5% |
| Cubans | 99.9 /100 | #41 | Exceptional 16.5% |
| Hungarians | 99.9 /100 | #42 | Exceptional 16.5% |
| Immigrants | Canada | 99.8 /100 | #43 | Exceptional 16.5% |
| Macedonians | 99.8 /100 | #44 | Exceptional 16.5% |
| Immigrants | Europe | 99.8 /100 | #45 | Exceptional 16.5% |
| Immigrants | Colombia | 99.8 /100 | #46 | Exceptional 16.5% |
| Immigrants | Italy | 99.8 /100 | #47 | Exceptional 16.5% |
| Immigrants | North America | 99.8 /100 | #48 | Exceptional 16.5% |
| Iranians | 99.8 /100 | #49 | Exceptional 16.5% |
| Norwegians | 99.8 /100 | #50 | Exceptional 16.5% |
| Immigrants | Korea | 99.8 /100 | #51 | Exceptional 16.5% |
| Soviet Union | 99.8 /100 | #52 | Exceptional 16.5% |
Demographics Similar to Trinidadians and Tobagonians by Cognitive Disability
In terms of cognitive disability, the demographic groups most similar to Trinidadians and Tobagonians are Immigrants from Thailand (17.9%, a difference of 0.020%), Jamaican (17.9%, a difference of 0.090%), Samoan (17.9%, a difference of 0.090%), French American Indian (17.9%, a difference of 0.10%), and Immigrants from Bangladesh (17.8%, a difference of 0.13%).
| Demographics | Rating | Rank | Cognitive Disability |
| Cheyenne | 1.7 /100 | #238 | Tragic 17.8% |
| Cajuns | 1.4 /100 | #239 | Tragic 17.8% |
| Iraqis | 1.4 /100 | #240 | Tragic 17.8% |
| Mexicans | 1.1 /100 | #241 | Tragic 17.8% |
| Paiute | 1.1 /100 | #242 | Tragic 17.8% |
| Immigrants | Bangladesh | 1.0 /100 | #243 | Tragic 17.8% |
| Jamaicans | 0.9 /100 | #244 | Tragic 17.9% |
| Trinidadians and Tobagonians | 0.8 /100 | #245 | Tragic 17.9% |
| Immigrants | Thailand | 0.8 /100 | #246 | Tragic 17.9% |
| Samoans | 0.7 /100 | #247 | Tragic 17.9% |
| French American Indians | 0.7 /100 | #248 | Tragic 17.9% |
| Cree | 0.7 /100 | #249 | Tragic 17.9% |
| Immigrants | Ethiopia | 0.7 /100 | #250 | Tragic 17.9% |
| Malaysians | 0.6 /100 | #251 | Tragic 17.9% |
| Immigrants | Grenada | 0.6 /100 | #252 | Tragic 17.9% |