Immigrants from Europe vs Brazilian Vision Disability
COMPARE
Immigrants from Europe
Brazilian
Vision Disability
Vision Disability Comparison
Immigrants from Europe
Brazilians
2.1%
VISION DISABILITY
96.1/ 100
METRIC RATING
93rd/ 347
METRIC RANK
2.1%
VISION DISABILITY
62.2/ 100
METRIC RATING
168th/ 347
METRIC RANK
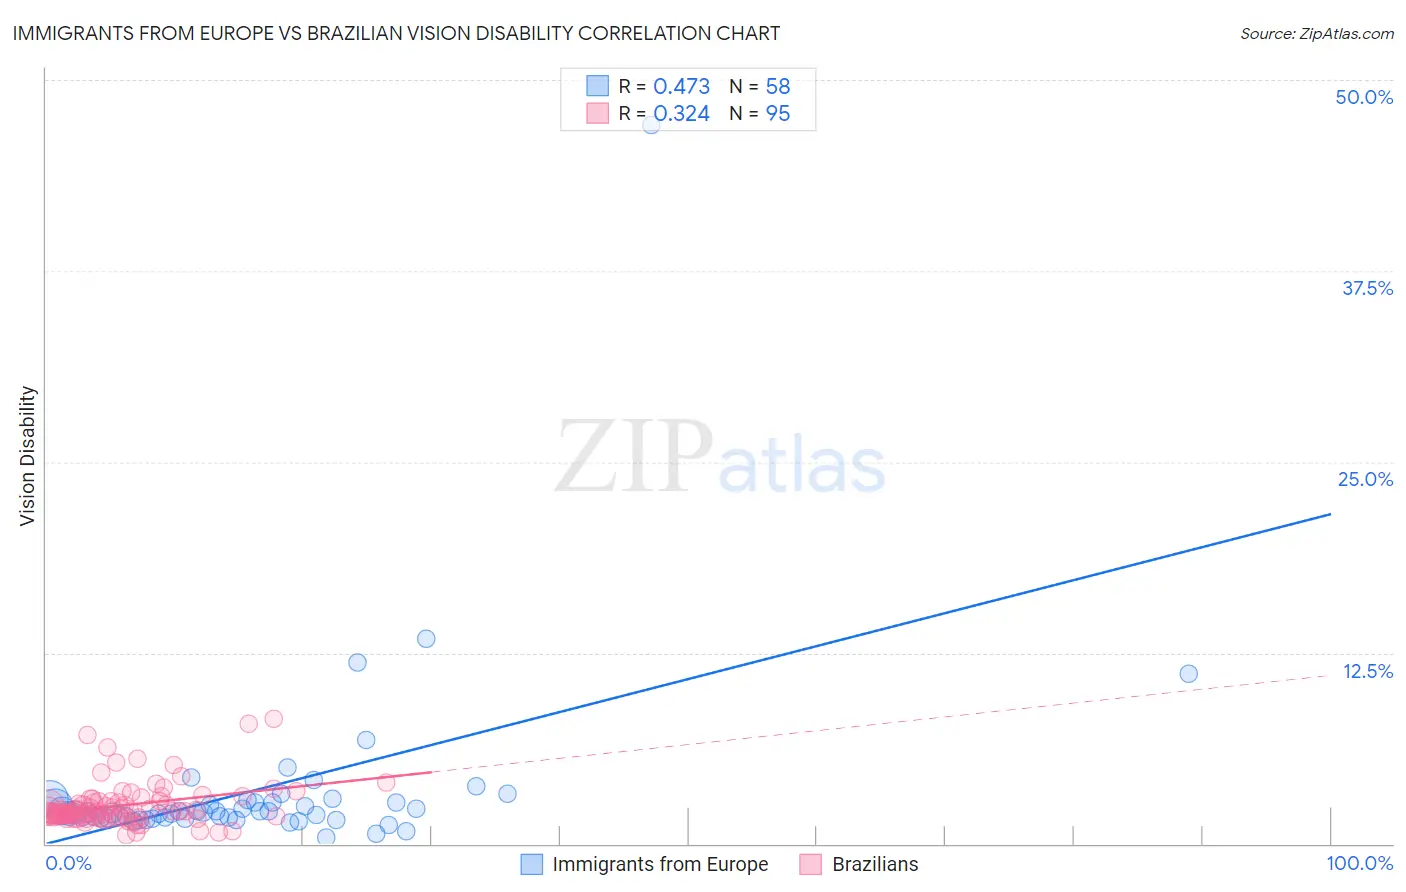
Immigrants from Europe vs Brazilian Vision Disability Correlation Chart
The statistical analysis conducted on geographies consisting of 546,008,895 people shows a moderate positive correlation between the proportion of Immigrants from Europe and percentage of population with vision disability in the United States with a correlation coefficient (R) of 0.473 and weighted average of 2.1%. Similarly, the statistical analysis conducted on geographies consisting of 323,719,841 people shows a mild positive correlation between the proportion of Brazilians and percentage of population with vision disability in the United States with a correlation coefficient (R) of 0.324 and weighted average of 2.1%, a difference of 4.5%.
Vision Disability Correlation Summary
| Measurement | Immigrants from Europe | Brazilian |
| Minimum | 0.41% | 0.54% |
| Maximum | 47.1% | 8.2% |
| Range | 46.7% | 7.7% |
| Mean | 3.5% | 2.5% |
| Median | 2.1% | 2.1% |
| Interquartile 25% (IQ1) | 1.7% | 1.7% |
| Interquartile 75% (IQ3) | 2.7% | 2.8% |
| Interquartile Range (IQR) | 1.0% | 1.1% |
| Standard Deviation (Sample) | 6.3% | 1.4% |
| Standard Deviation (Population) | 6.3% | 1.4% |
Similar Demographics by Vision Disability
Demographics Similar to Immigrants from Europe by Vision Disability
In terms of vision disability, the demographic groups most similar to Immigrants from Europe are Immigrants from Croatia (2.1%, a difference of 0.020%), Immigrants from Syria (2.1%, a difference of 0.050%), Immigrants from Somalia (2.1%, a difference of 0.060%), Australian (2.1%, a difference of 0.090%), and Romanian (2.1%, a difference of 0.15%).
| Demographics | Rating | Rank | Vision Disability |
| Immigrants | Moldova | 97.2 /100 | #86 | Exceptional 2.0% |
| Immigrants | Switzerland | 97.0 /100 | #87 | Exceptional 2.0% |
| Norwegians | 97.0 /100 | #88 | Exceptional 2.0% |
| Immigrants | Eastern Africa | 97.0 /100 | #89 | Exceptional 2.0% |
| Immigrants | Lebanon | 96.7 /100 | #90 | Exceptional 2.1% |
| Immigrants | Somalia | 96.2 /100 | #91 | Exceptional 2.1% |
| Immigrants | Syria | 96.2 /100 | #92 | Exceptional 2.1% |
| Immigrants | Europe | 96.1 /100 | #93 | Exceptional 2.1% |
| Immigrants | Croatia | 96.0 /100 | #94 | Exceptional 2.1% |
| Australians | 95.9 /100 | #95 | Exceptional 2.1% |
| Romanians | 95.7 /100 | #96 | Exceptional 2.1% |
| Immigrants | Afghanistan | 95.6 /100 | #97 | Exceptional 2.1% |
| Immigrants | South Africa | 95.4 /100 | #98 | Exceptional 2.1% |
| Estonians | 95.3 /100 | #99 | Exceptional 2.1% |
| Greeks | 95.1 /100 | #100 | Exceptional 2.1% |
Demographics Similar to Brazilians by Vision Disability
In terms of vision disability, the demographic groups most similar to Brazilians are Immigrants from Africa (2.1%, a difference of 0.030%), Immigrants from England (2.1%, a difference of 0.040%), Immigrants from Iraq (2.1%, a difference of 0.18%), Immigrants from Bangladesh (2.1%, a difference of 0.23%), and Icelander (2.1%, a difference of 0.27%).
| Demographics | Rating | Rank | Vision Disability |
| Iraqis | 67.7 /100 | #161 | Good 2.1% |
| Hungarians | 67.4 /100 | #162 | Good 2.1% |
| Icelanders | 66.1 /100 | #163 | Good 2.1% |
| Immigrants | Bangladesh | 65.5 /100 | #164 | Good 2.1% |
| Immigrants | Iraq | 64.8 /100 | #165 | Good 2.1% |
| Immigrants | England | 62.8 /100 | #166 | Good 2.1% |
| Immigrants | Africa | 62.6 /100 | #167 | Good 2.1% |
| Brazilians | 62.2 /100 | #168 | Good 2.1% |
| South American Indians | 57.4 /100 | #169 | Average 2.2% |
| Swiss | 55.7 /100 | #170 | Average 2.2% |
| Lebanese | 54.3 /100 | #171 | Average 2.2% |
| Northern Europeans | 50.1 /100 | #172 | Average 2.2% |
| Scandinavians | 50.0 /100 | #173 | Average 2.2% |
| Immigrants | Canada | 50.0 /100 | #174 | Average 2.2% |
| Immigrants | Fiji | 47.6 /100 | #175 | Average 2.2% |