Immigrants from England vs Danish Ambulatory Disability
COMPARE
Immigrants from England
Danish
Ambulatory Disability
Ambulatory Disability Comparison
Immigrants from England
Danes
6.1%
AMBULATORY DISABILITY
45.4/ 100
METRIC RATING
177th/ 347
METRIC RANK
5.8%
AMBULATORY DISABILITY
96.6/ 100
METRIC RATING
111th/ 347
METRIC RANK
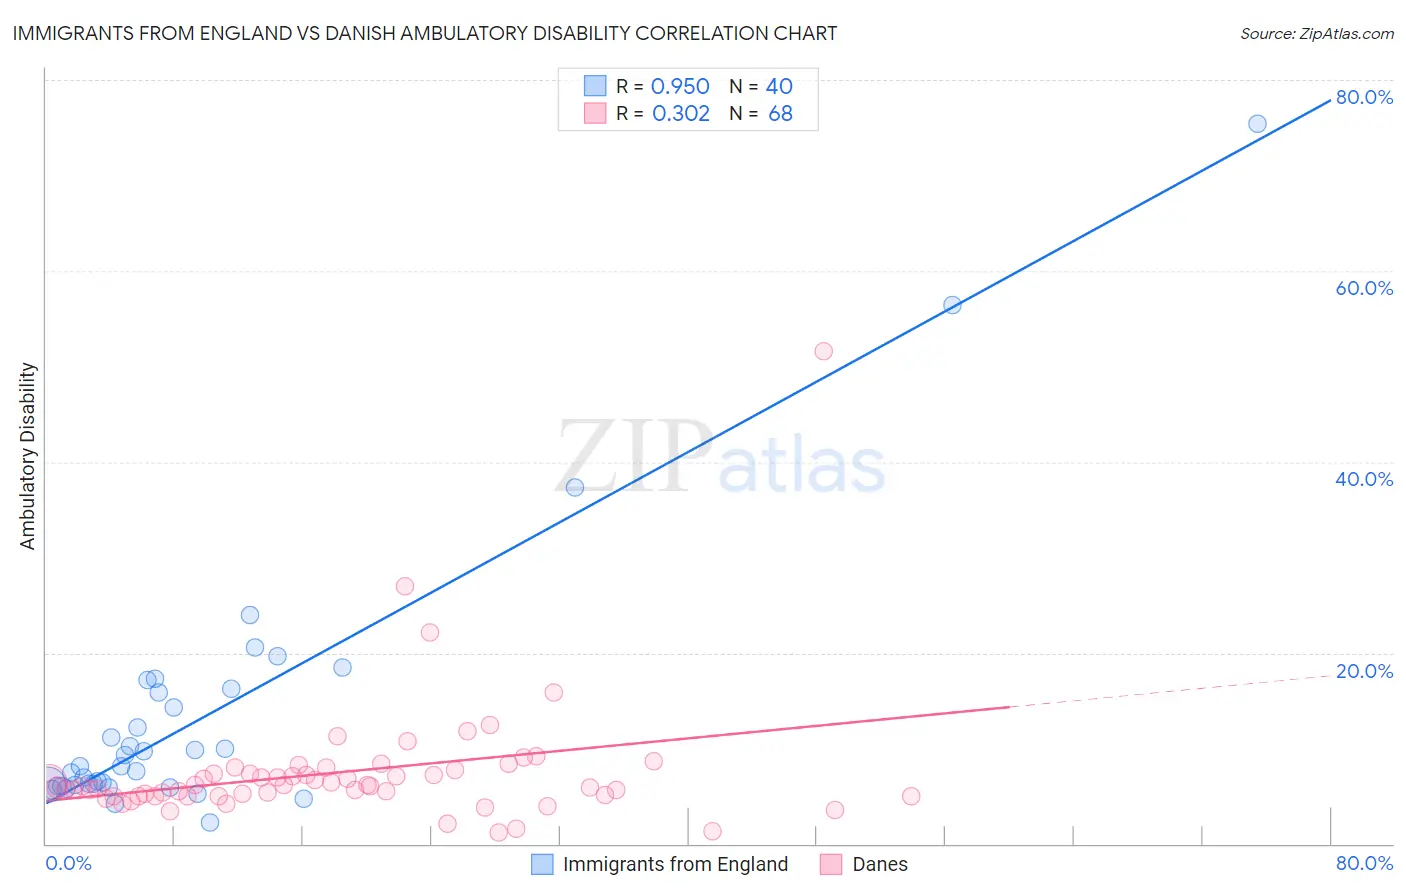
Immigrants from England vs Danish Ambulatory Disability Correlation Chart
The statistical analysis conducted on geographies consisting of 391,842,020 people shows a perfect positive correlation between the proportion of Immigrants from England and percentage of population with ambulatory disability in the United States with a correlation coefficient (R) of 0.950 and weighted average of 6.1%. Similarly, the statistical analysis conducted on geographies consisting of 473,952,893 people shows a mild positive correlation between the proportion of Danes and percentage of population with ambulatory disability in the United States with a correlation coefficient (R) of 0.302 and weighted average of 5.8%, a difference of 4.9%.
Ambulatory Disability Correlation Summary
| Measurement | Immigrants from England | Danish |
| Minimum | 2.3% | 1.2% |
| Maximum | 75.4% | 51.6% |
| Range | 73.1% | 50.4% |
| Mean | 13.3% | 7.5% |
| Median | 8.2% | 6.1% |
| Interquartile 25% (IQ1) | 6.1% | 5.0% |
| Interquartile 75% (IQ3) | 16.0% | 7.5% |
| Interquartile Range (IQR) | 9.9% | 2.5% |
| Standard Deviation (Sample) | 14.1% | 6.7% |
| Standard Deviation (Population) | 13.9% | 6.7% |
Similar Demographics by Ambulatory Disability
Demographics Similar to Immigrants from England by Ambulatory Disability
In terms of ambulatory disability, the demographic groups most similar to Immigrants from England are Immigrants from North America (6.1%, a difference of 0.010%), Scandinavian (6.1%, a difference of 0.050%), Austrian (6.1%, a difference of 0.070%), Immigrants from Nicaragua (6.1%, a difference of 0.080%), and Vietnamese (6.1%, a difference of 0.10%).
| Demographics | Rating | Rank | Ambulatory Disability |
| Immigrants | Ecuador | 53.8 /100 | #170 | Average 6.1% |
| Moroccans | 52.6 /100 | #171 | Average 6.1% |
| Immigrants | Burma/Myanmar | 52.2 /100 | #172 | Average 6.1% |
| Croatians | 51.2 /100 | #173 | Average 6.1% |
| Immigrants | Canada | 50.0 /100 | #174 | Average 6.1% |
| Vietnamese | 47.2 /100 | #175 | Average 6.1% |
| Immigrants | North America | 45.6 /100 | #176 | Average 6.1% |
| Immigrants | England | 45.4 /100 | #177 | Average 6.1% |
| Scandinavians | 44.5 /100 | #178 | Average 6.1% |
| Austrians | 44.1 /100 | #179 | Average 6.1% |
| Immigrants | Nicaragua | 43.9 /100 | #180 | Average 6.1% |
| Swiss | 43.1 /100 | #181 | Average 6.1% |
| Serbians | 42.8 /100 | #182 | Average 6.1% |
| Immigrants | Thailand | 42.2 /100 | #183 | Average 6.1% |
| Immigrants | Ghana | 41.2 /100 | #184 | Average 6.1% |
Demographics Similar to Danes by Ambulatory Disability
In terms of ambulatory disability, the demographic groups most similar to Danes are Immigrants from Colombia (5.8%, a difference of 0.070%), South African (5.9%, a difference of 0.13%), Immigrants from Netherlands (5.8%, a difference of 0.25%), Colombian (5.8%, a difference of 0.27%), and Uruguayan (5.8%, a difference of 0.28%).
| Demographics | Rating | Rank | Ambulatory Disability |
| New Zealanders | 97.6 /100 | #104 | Exceptional 5.8% |
| Immigrants | Czechoslovakia | 97.4 /100 | #105 | Exceptional 5.8% |
| Immigrants | Morocco | 97.3 /100 | #106 | Exceptional 5.8% |
| Uruguayans | 97.2 /100 | #107 | Exceptional 5.8% |
| Colombians | 97.2 /100 | #108 | Exceptional 5.8% |
| Immigrants | Netherlands | 97.1 /100 | #109 | Exceptional 5.8% |
| Immigrants | Colombia | 96.7 /100 | #110 | Exceptional 5.8% |
| Danes | 96.6 /100 | #111 | Exceptional 5.8% |
| South Africans | 96.3 /100 | #112 | Exceptional 5.9% |
| Immigrants | Uruguay | 95.6 /100 | #113 | Exceptional 5.9% |
| Immigrants | Poland | 95.4 /100 | #114 | Exceptional 5.9% |
| South American Indians | 94.8 /100 | #115 | Exceptional 5.9% |
| Immigrants | Africa | 94.7 /100 | #116 | Exceptional 5.9% |
| Immigrants | South Eastern Asia | 93.6 /100 | #117 | Exceptional 5.9% |
| Russians | 93.4 /100 | #118 | Exceptional 5.9% |