Immigrants from Eastern Asia vs Immigrants from Senegal Disability Age 18 to 34

COMPARE

Immigrants from Eastern Asia
Race
Ancestry
AfghanAfricanAlaska NativeAlaskan AthabascanAlbanianAleutAlsatianAmericanApacheArabArapahoArgentineanArmenianAssyrian/Chaldean/SyriacAustralianAustrianBahamianBangladeshiBarbadianBasqueBelgianBelizeanBermudanBhutaneseBlackfeetBolivianBrazilianBritishBritish West IndianBulgarianBurmeseCajunCambodianCanadianCape VerdeanCarpatho RusynCelticCentral AmericanCentral American IndianCherokeeCheyenneChickasawChileanChineseChippewaChoctawColombianColvilleComancheCosta RicanCreeCreekCroatianCrowCubanCypriotCzechCzechoslovakianDanishDelawareDominicanDutchDutch West IndianEastern EuropeanEcuadorianEgyptianEnglishEstonianEthiopianEuropeanFijianFilipinoFinnishFrenchFrench American IndianFrench CanadianGermanGerman RussianGhanaianGreekGuamanian/ChamorroGuatemalanGuyaneseHaitianHmongHonduranHopiHoumaHungarianIcelanderIndian (Asian)IndonesianInupiatIranianIraqiIrishIroquoisIsraeliItalianJamaicanJapaneseJordanianKenyanKiowaKoreanLaotianLatvianLebaneseLiberianLithuanianLumbeeLuxembourgerMacedonianMalaysianMalteseMarshalleseMenomineeMexicanMexican American IndianMongolianMoroccanNative HawaiianNavajoNepaleseNew ZealanderNicaraguanNigerianNorthern EuropeanNorwegianOkinawanOsageOttawaPaiutePakistaniPalestinianPanamanianParaguayanPennsylvania GermanPeruvianPimaPolishPortuguesePotawatomiPuebloPuerto RicanPuget Sound SalishRomanianRussianSalvadoranSamoanScandinavianScotch-IrishScottishSeminoleSenegaleseSerbianShoshoneSierra LeoneanSiouxSlavicSlovakSloveneSomaliSouth AfricanSouth AmericanSouth American IndianSoviet UnionSpaniardSpanishSpanish AmericanSpanish American IndianSri LankanSubsaharan AfricanSudaneseSwedishSwissSyrianTaiwaneseThaiTlingit-HaidaTohono O'OdhamTonganTrinidadian and TobagonianTsimshianTurkishU.S. Virgin IslanderUgandanUkrainianUruguayanUteVenezuelanVietnameseWelshWest IndianYakamaYaquiYugoslavianYumanYup'ikZimbabwean
Immigration
NonimmigrantsImmigrantsAfghanistanAfricaAlbaniaArgentinaArmeniaAsiaAustraliaAustriaBahamasBangladeshBarbadosBelarusBelgiumBelizeBoliviaBosnia and HerzegovinaBrazilBulgariaBurma/MyanmarCabo VerdeCambodiaCameroonCanadaCaribbeanCentral AmericaChileChinaColombiaCongoCosta RicaCroatiaCubaCzechoslovakiaDenmarkDominicaDominican RepublicEastern AfricaEastern AsiaEastern EuropeEcuadorEgyptEl SalvadorEnglandEritreaEthiopiaEuropeFijiFranceGermanyGhanaGreeceGrenadaGuatemalaGuyanaHaitiHondurasHong KongHungaryIndiaIndonesiaIranIraqIrelandIsraelItalyJamaicaJapanJordanKazakhstanKenyaKoreaKuwaitLaosLatin AmericaLatviaLebanonLiberiaLithuaniaMalaysiaMexicoMicronesiaMiddle AfricaMoldovaMoroccoNepalNetherlandsNicaraguaNigeriaNorth AmericaNorth MacedoniaNorthern AfricaNorthern EuropeNorwayOceaniaPakistanPanamaPeruPhilippinesPolandPortugalRomaniaRussiaSaudi ArabiaScotlandSerbiaSierra LeoneSingaporeSomaliaSouth AfricaSouth AmericaSouth Central AsiaSouth Eastern AsiaSouthern EuropeSpainSri LankaSt. Vincent and the GrenadinesSudanSwedenSwitzerlandSyriaTaiwanThailandTrinidad and TobagoTurkeyUgandaUkraineUruguayUzbekistanVenezuelaVietnamWest IndiesWestern AfricaWestern AsiaWestern EuropeYemenZaireZimbabweAzores
Immigrants from Senegal
Race
Ancestry
AfghanAfricanAlaska NativeAlaskan AthabascanAlbanianAleutAlsatianAmericanApacheArabArapahoArgentineanArmenianAssyrian/Chaldean/SyriacAustralianAustrianBahamianBangladeshiBarbadianBasqueBelgianBelizeanBermudanBhutaneseBlackfeetBolivianBrazilianBritishBritish West IndianBulgarianBurmeseCajunCambodianCanadianCape VerdeanCarpatho RusynCelticCentral AmericanCentral American IndianCherokeeCheyenneChickasawChileanChineseChippewaChoctawColombianColvilleComancheCosta RicanCreeCreekCroatianCrowCubanCypriotCzechCzechoslovakianDanishDelawareDominicanDutchDutch West IndianEastern EuropeanEcuadorianEgyptianEnglishEstonianEthiopianEuropeanFijianFilipinoFinnishFrenchFrench American IndianFrench CanadianGermanGerman RussianGhanaianGreekGuamanian/ChamorroGuatemalanGuyaneseHaitianHmongHonduranHopiHoumaHungarianIcelanderIndian (Asian)IndonesianInupiatIranianIraqiIrishIroquoisIsraeliItalianJamaicanJapaneseJordanianKenyanKiowaKoreanLaotianLatvianLebaneseLiberianLithuanianLumbeeLuxembourgerMacedonianMalaysianMalteseMarshalleseMenomineeMexicanMexican American IndianMongolianMoroccanNative HawaiianNavajoNepaleseNew ZealanderNicaraguanNigerianNorthern EuropeanNorwegianOkinawanOsageOttawaPaiutePakistaniPalestinianPanamanianParaguayanPennsylvania GermanPeruvianPimaPolishPortuguesePotawatomiPuebloPuerto RicanPuget Sound SalishRomanianRussianSalvadoranSamoanScandinavianScotch-IrishScottishSeminoleSenegaleseSerbianShoshoneSierra LeoneanSiouxSlavicSlovakSloveneSomaliSouth AfricanSouth AmericanSouth American IndianSoviet UnionSpaniardSpanishSpanish AmericanSpanish American IndianSri LankanSubsaharan AfricanSudaneseSwedishSwissSyrianTaiwaneseThaiTlingit-HaidaTohono O'OdhamTonganTrinidadian and TobagonianTsimshianTurkishU.S. Virgin IslanderUgandanUkrainianUruguayanUteVenezuelanVietnameseWelshWest IndianYakamaYaquiYugoslavianYumanYup'ikZimbabwean
Immigration
NonimmigrantsImmigrantsAfghanistanAfricaAlbaniaArgentinaArmeniaAsiaAustraliaAustriaBahamasBangladeshBarbadosBelarusBelgiumBelizeBoliviaBosnia and HerzegovinaBrazilBulgariaBurma/MyanmarCabo VerdeCambodiaCameroonCanadaCaribbeanCentral AmericaChileChinaColombiaCongoCosta RicaCroatiaCubaCzechoslovakiaDenmarkDominicaDominican RepublicEastern AfricaEastern EuropeEcuadorEgyptEl SalvadorEnglandEritreaEthiopiaEuropeFijiFranceGermanyGhanaGreeceGrenadaGuatemalaGuyanaHaitiHondurasHong KongHungaryIndiaIndonesiaIranIraqIrelandIsraelItalyJamaicaJapanJordanKazakhstanKenyaKoreaKuwaitLaosLatin AmericaLatviaLebanonLiberiaLithuaniaMalaysiaMexicoMicronesiaMiddle AfricaMoldovaMoroccoNepalNetherlandsNicaraguaNigeriaNorth AmericaNorth MacedoniaNorthern AfricaNorthern EuropeNorwayOceaniaPakistanPanamaPeruPhilippinesPolandPortugalRomaniaRussiaSaudi ArabiaScotlandSenegalSerbiaSierra LeoneSingaporeSomaliaSouth AfricaSouth AmericaSouth Central AsiaSouth Eastern AsiaSouthern EuropeSpainSri LankaSt. Vincent and the GrenadinesSudanSwedenSwitzerlandSyriaTaiwanThailandTrinidad and TobagoTurkeyUgandaUkraineUruguayUzbekistanVenezuelaVietnamWest IndiesWestern AfricaWestern AsiaWestern EuropeYemenZaireZimbabweAzores
Disability Age 18 to 34
Income
Poverty
Unemployment
Labor Participation
Family Structure
Vehicle Availability
Education Level
Disability

Disability Age 18 to 34 Comparison

Immigrants from Eastern Asia

Immigrants from Senegal

Exceptional
Tragic
5.6%
DISABILITY AGE 18 TO 34
100.0/ 100
METRIC RATING
17th/ 347
METRIC RANK
6.9%
DISABILITY AGE 18 TO 34
5.5/ 100
METRIC RATING
220th/ 347
METRIC RANK

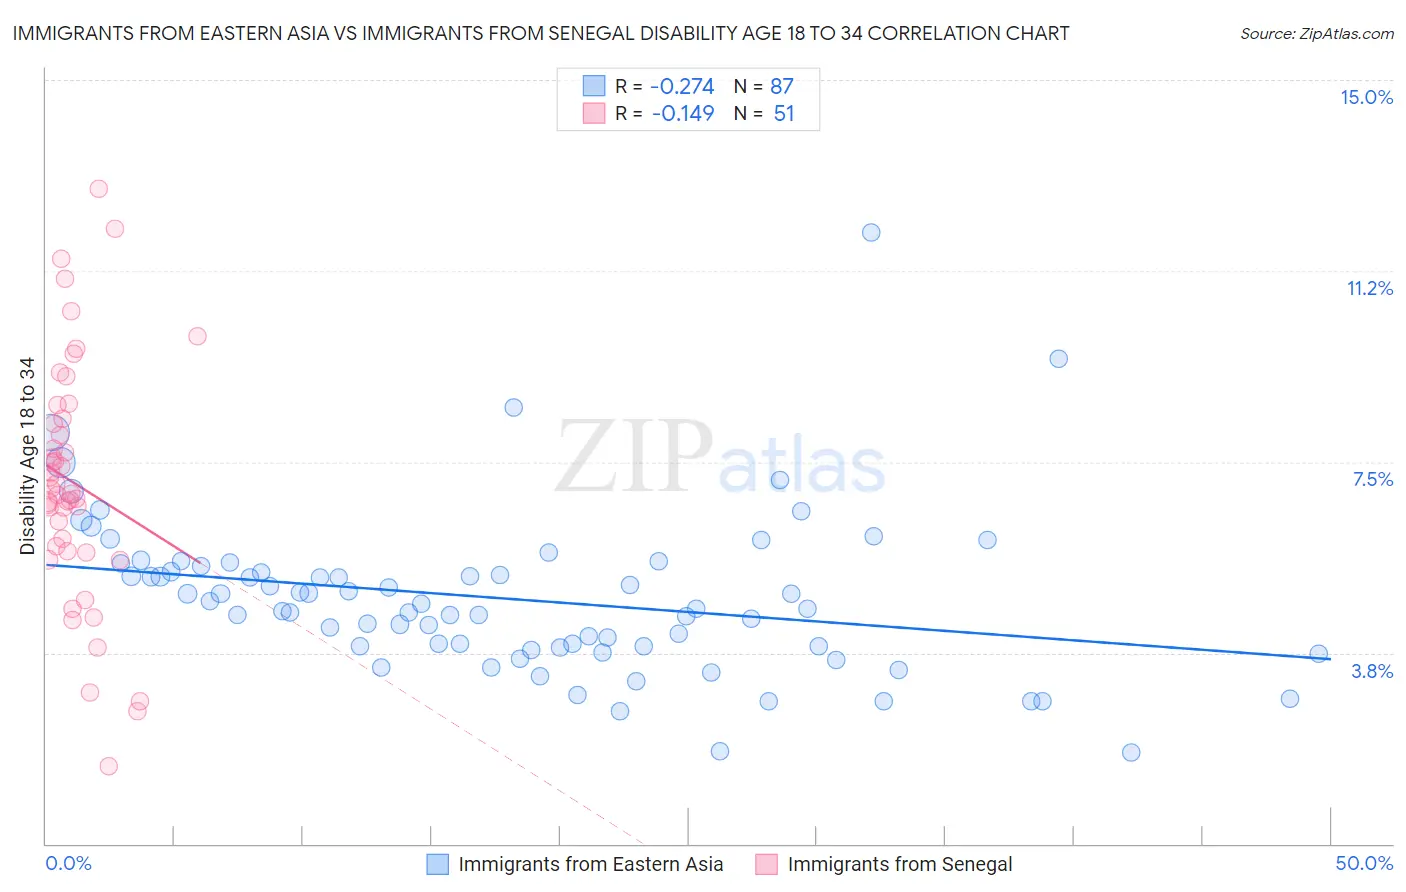
Immigrants from Eastern Asia vs Immigrants from Senegal Disability Age 18 to 34 Correlation Chart

The statistical analysis conducted on geographies consisting of 498,053,268 people shows a weak negative correlation between the proportion of Immigrants from Eastern Asia and percentage of population with a disability between the ages 18 and 35 in the United States with a correlation coefficient (R) of -0.274 and weighted average of 5.6%. Similarly, the statistical analysis conducted on geographies consisting of 90,111,749 people shows a poor negative correlation between the proportion of Immigrants from Senegal and percentage of population with a disability between the ages 18 and 35 in the United States with a correlation coefficient (R) of -0.149 and weighted average of 6.9%, a difference of 24.1%.
Immigrants from Eastern Asia vs Immigrants from Senegal Disability Age 18 to 34

Disability Age 18 to 34 Correlation Summary

MeasurementImmigrants from Eastern AsiaImmigrants from Senegal
Minimum1.8%1.5%
Maximum12.0%12.9%
Range10.2%11.3%
Mean4.8%7.1%
Median4.6%6.9%
Interquartile 25% (IQ1)3.9%5.8%
Interquartile 75% (IQ3)5.5%8.4%
Interquartile Range (IQR)1.6%2.6%
Standard Deviation (Sample)1.6%2.4%
Standard Deviation (Population)1.6%2.3%

Similar Demographics by Disability Age 18 to 34

Demographics Similar to Immigrants from Eastern Asia by Disability Age 18 to 34

In terms of disability age 18 to 34, the demographic groups most similar to Immigrants from Eastern Asia are Immigrants from Israel (5.6%, a difference of 0.17%), Immigrants from India (5.6%, a difference of 0.20%), Indian (Asian) (5.5%, a difference of 0.58%), Immigrants from Iran (5.5%, a difference of 0.73%), and Immigrants from Bolivia (5.6%, a difference of 0.76%).
DemographicsRating | RankDisability Age 18 to 34
Immigrants | Uzbekistan
100.0
/100
|
#10
Exceptional
5.5%
Vietnamese
100.0
/100
|
#11
Exceptional
5.5%
Immigrants | St. Vincent and the Grenadines
100.0
/100
|
#12
Exceptional
5.5%
Immigrants | Iran
100.0
/100
|
#13
Exceptional
5.5%
Indians (Asian)
100.0
/100
|
#14
Exceptional
5.5%
Immigrants | India
100.0
/100
|
#15
Exceptional
5.6%
Immigrants | Israel
100.0
/100
|
#16
Exceptional
5.6%
Immigrants | Eastern Asia
100.0
/100
|
#17
Exceptional
5.6%
Immigrants | Bolivia
100.0
/100
|
#18
Exceptional
5.6%
Thais
100.0
/100
|
#19
Exceptional
5.6%
Immigrants | Bangladesh
100.0
/100
|
#20
Exceptional
5.6%
Immigrants | South Central Asia
100.0
/100
|
#21
Exceptional
5.7%
Immigrants | Nicaragua
100.0
/100
|
#22
Exceptional
5.7%
Cubans
100.0
/100
|
#23
Exceptional
5.7%
Immigrants | Argentina
100.0
/100
|
#24
Exceptional
5.7%

Demographics Similar to Immigrants from Senegal by Disability Age 18 to 34

In terms of disability age 18 to 34, the demographic groups most similar to Immigrants from Senegal are Immigrants from Middle Africa (6.9%, a difference of 0.010%), Immigrants from England (6.9%, a difference of 0.080%), Carpatho Rusyn (6.9%, a difference of 0.11%), Senegalese (6.9%, a difference of 0.20%), and Central American Indian (6.9%, a difference of 0.28%).
DemographicsRating | RankDisability Age 18 to 34
Immigrants | Western Europe
9.1
/100
|
#213
Tragic
6.9%
Serbians
8.2
/100
|
#214
Tragic
6.9%
Immigrants | Thailand
7.5
/100
|
#215
Tragic
6.9%
Sudanese
7.0
/100
|
#216
Tragic
6.9%
Immigrants | Kenya
6.9
/100
|
#217
Tragic
6.9%
Ukrainians
6.7
/100
|
#218
Tragic
6.9%
Hawaiians
6.5
/100
|
#219
Tragic
6.9%
Immigrants | Senegal
5.5
/100
|
#220
Tragic
6.9%
Immigrants | Middle Africa
5.5
/100
|
#221
Tragic
6.9%
Immigrants | England
5.3
/100
|
#222
Tragic
6.9%
Carpatho Rusyns
5.2
/100
|
#223
Tragic
6.9%
Senegalese
4.9
/100
|
#224
Tragic
6.9%
Central American Indians
4.7
/100
|
#225
Tragic
6.9%
Ugandans
4.4
/100
|
#226
Tragic
6.9%
Immigrants | Canada
4.3
/100
|
#227
Tragic
7.0%