Immigrants from Eastern Africa vs Immigrants from Mexico Disability Age Over 75

COMPARE

Immigrants from Eastern Africa
Race
Ancestry
AfghanAfricanAlaska NativeAlaskan AthabascanAlbanianAleutAlsatianAmericanApacheArabArapahoArgentineanArmenianAssyrian/Chaldean/SyriacAustralianAustrianBahamianBangladeshiBarbadianBasqueBelgianBelizeanBermudanBhutaneseBlackfeetBolivianBrazilianBritishBritish West IndianBulgarianBurmeseCajunCambodianCanadianCape VerdeanCarpatho RusynCelticCentral AmericanCentral American IndianCherokeeCheyenneChickasawChileanChineseChippewaChoctawColombianColvilleComancheCosta RicanCreeCreekCroatianCrowCubanCypriotCzechCzechoslovakianDanishDelawareDominicanDutchDutch West IndianEastern EuropeanEcuadorianEgyptianEnglishEstonianEthiopianEuropeanFijianFilipinoFinnishFrenchFrench American IndianFrench CanadianGermanGerman RussianGhanaianGreekGuamanian/ChamorroGuatemalanGuyaneseHaitianHmongHonduranHopiHoumaHungarianIcelanderIndian (Asian)IndonesianInupiatIranianIraqiIrishIroquoisIsraeliItalianJamaicanJapaneseJordanianKenyanKiowaKoreanLaotianLatvianLebaneseLiberianLithuanianLumbeeLuxembourgerMacedonianMalaysianMalteseMarshalleseMenomineeMexicanMexican American IndianMongolianMoroccanNative HawaiianNavajoNepaleseNew ZealanderNicaraguanNigerianNorthern EuropeanNorwegianOkinawanOsageOttawaPaiutePakistaniPalestinianPanamanianParaguayanPennsylvania GermanPeruvianPimaPolishPortuguesePotawatomiPuebloPuerto RicanPuget Sound SalishRomanianRussianSalvadoranSamoanScandinavianScotch-IrishScottishSeminoleSenegaleseSerbianShoshoneSierra LeoneanSiouxSlavicSlovakSloveneSomaliSouth AfricanSouth AmericanSouth American IndianSoviet UnionSpaniardSpanishSpanish AmericanSpanish American IndianSri LankanSubsaharan AfricanSudaneseSwedishSwissSyrianTaiwaneseThaiTlingit-HaidaTohono O'OdhamTonganTrinidadian and TobagonianTsimshianTurkishU.S. Virgin IslanderUgandanUkrainianUruguayanUteVenezuelanVietnameseWelshWest IndianYakamaYaquiYugoslavianYumanYup'ikZimbabwean
Immigration
NonimmigrantsImmigrantsAfghanistanAfricaAlbaniaArgentinaArmeniaAsiaAustraliaAustriaBahamasBangladeshBarbadosBelarusBelgiumBelizeBoliviaBosnia and HerzegovinaBrazilBulgariaBurma/MyanmarCabo VerdeCambodiaCameroonCanadaCaribbeanCentral AmericaChileChinaColombiaCongoCosta RicaCroatiaCubaCzechoslovakiaDenmarkDominicaDominican RepublicEastern AfricaEastern AsiaEastern EuropeEcuadorEgyptEl SalvadorEnglandEritreaEthiopiaEuropeFijiFranceGermanyGhanaGreeceGrenadaGuatemalaGuyanaHaitiHondurasHong KongHungaryIndiaIndonesiaIranIraqIrelandIsraelItalyJamaicaJapanJordanKazakhstanKenyaKoreaKuwaitLaosLatin AmericaLatviaLebanonLiberiaLithuaniaMalaysiaMicronesiaMiddle AfricaMoldovaMoroccoNepalNetherlandsNicaraguaNigeriaNorth AmericaNorth MacedoniaNorthern AfricaNorthern EuropeNorwayOceaniaPakistanPanamaPeruPhilippinesPolandPortugalRomaniaRussiaSaudi ArabiaScotlandSenegalSerbiaSierra LeoneSingaporeSomaliaSouth AfricaSouth AmericaSouth Central AsiaSouth Eastern AsiaSouthern EuropeSpainSri LankaSt. Vincent and the GrenadinesSudanSwedenSwitzerlandSyriaTaiwanThailandTrinidad and TobagoTurkeyUgandaUkraineUruguayUzbekistanVenezuelaVietnamWest IndiesWestern AfricaWestern AsiaWestern EuropeYemenZaireZimbabweAzores
Immigrants from Mexico
Race
Ancestry
AfghanAfricanAlaska NativeAlaskan AthabascanAlbanianAleutAlsatianAmericanApacheArabArapahoArgentineanArmenianAssyrian/Chaldean/SyriacAustralianAustrianBahamianBangladeshiBarbadianBasqueBelgianBelizeanBermudanBhutaneseBlackfeetBolivianBrazilianBritishBritish West IndianBulgarianBurmeseCajunCambodianCanadianCape VerdeanCarpatho RusynCelticCentral AmericanCentral American IndianCherokeeCheyenneChickasawChileanChineseChippewaChoctawColombianColvilleComancheCosta RicanCreeCreekCroatianCrowCubanCypriotCzechCzechoslovakianDanishDelawareDominicanDutchDutch West IndianEastern EuropeanEcuadorianEgyptianEnglishEstonianEthiopianEuropeanFijianFilipinoFinnishFrenchFrench American IndianFrench CanadianGermanGerman RussianGhanaianGreekGuamanian/ChamorroGuatemalanGuyaneseHaitianHmongHonduranHopiHoumaHungarianIcelanderIndian (Asian)IndonesianInupiatIranianIraqiIrishIroquoisIsraeliItalianJamaicanJapaneseJordanianKenyanKiowaKoreanLaotianLatvianLebaneseLiberianLithuanianLumbeeLuxembourgerMacedonianMalaysianMalteseMarshalleseMenomineeMexicanMexican American IndianMongolianMoroccanNative HawaiianNavajoNepaleseNew ZealanderNicaraguanNigerianNorthern EuropeanNorwegianOkinawanOsageOttawaPaiutePakistaniPalestinianPanamanianParaguayanPennsylvania GermanPeruvianPimaPolishPortuguesePotawatomiPuebloPuerto RicanPuget Sound SalishRomanianRussianSalvadoranSamoanScandinavianScotch-IrishScottishSeminoleSenegaleseSerbianShoshoneSierra LeoneanSiouxSlavicSlovakSloveneSomaliSouth AfricanSouth AmericanSouth American IndianSoviet UnionSpaniardSpanishSpanish AmericanSpanish American IndianSri LankanSubsaharan AfricanSudaneseSwedishSwissSyrianTaiwaneseThaiTlingit-HaidaTohono O'OdhamTonganTrinidadian and TobagonianTsimshianTurkishU.S. Virgin IslanderUgandanUkrainianUruguayanUteVenezuelanVietnameseWelshWest IndianYakamaYaquiYugoslavianYumanYup'ikZimbabwean
Immigration
NonimmigrantsImmigrantsAfghanistanAfricaAlbaniaArgentinaArmeniaAsiaAustraliaAustriaBahamasBangladeshBarbadosBelarusBelgiumBelizeBoliviaBosnia and HerzegovinaBrazilBulgariaBurma/MyanmarCabo VerdeCambodiaCameroonCanadaCaribbeanCentral AmericaChileChinaColombiaCongoCosta RicaCroatiaCubaCzechoslovakiaDenmarkDominicaDominican RepublicEastern AsiaEastern EuropeEcuadorEgyptEl SalvadorEnglandEritreaEthiopiaEuropeFijiFranceGermanyGhanaGreeceGrenadaGuatemalaGuyanaHaitiHondurasHong KongHungaryIndiaIndonesiaIranIraqIrelandIsraelItalyJamaicaJapanJordanKazakhstanKenyaKoreaKuwaitLaosLatin AmericaLatviaLebanonLiberiaLithuaniaMalaysiaMexicoMicronesiaMiddle AfricaMoldovaMoroccoNepalNetherlandsNicaraguaNigeriaNorth AmericaNorth MacedoniaNorthern AfricaNorthern EuropeNorwayOceaniaPakistanPanamaPeruPhilippinesPolandPortugalRomaniaRussiaSaudi ArabiaScotlandSenegalSerbiaSierra LeoneSingaporeSomaliaSouth AfricaSouth AmericaSouth Central AsiaSouth Eastern AsiaSouthern EuropeSpainSri LankaSt. Vincent and the GrenadinesSudanSwedenSwitzerlandSyriaTaiwanThailandTrinidad and TobagoTurkeyUgandaUkraineUruguayUzbekistanVenezuelaVietnamWest IndiesWestern AfricaWestern AsiaWestern EuropeYemenZaireZimbabweAzores
Disability Age Over 75
Income
Poverty
Unemployment
Labor Participation
Family Structure
Vehicle Availability
Education Level
Disability

Disability Age Over 75 Comparison

Immigrants from Eastern Africa

Immigrants from Mexico

Good
Tragic
47.2%
DISABILITY AGE OVER 75
65.5/ 100
METRIC RATING
163rd/ 347
METRIC RANK
51.1%
DISABILITY AGE OVER 75
0.0/ 100
METRIC RATING
314th/ 347
METRIC RANK

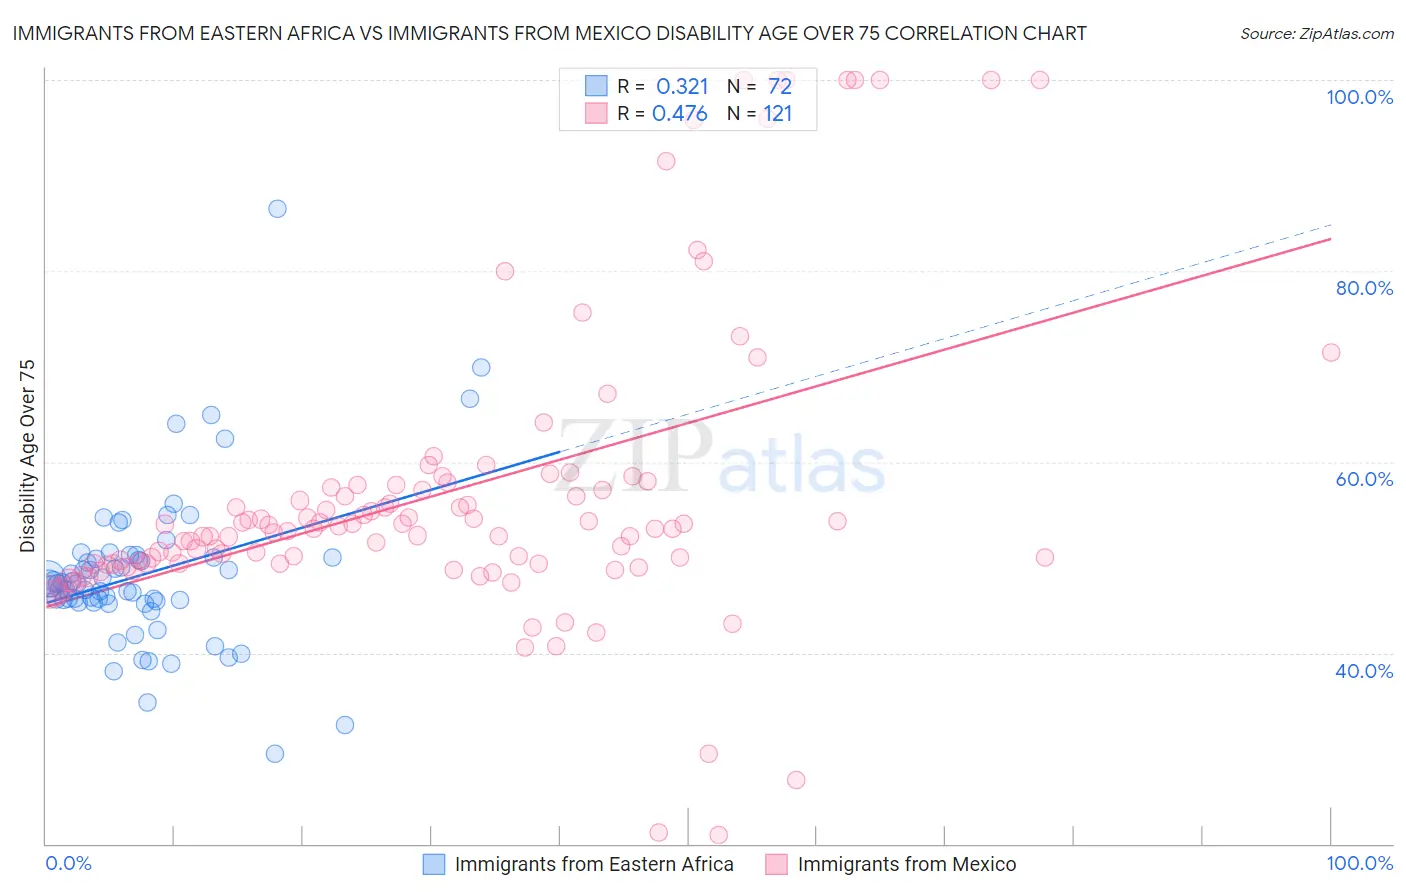
Immigrants from Eastern Africa vs Immigrants from Mexico Disability Age Over 75 Correlation Chart

The statistical analysis conducted on geographies consisting of 354,505,709 people shows a mild positive correlation between the proportion of Immigrants from Eastern Africa and percentage of population with a disability over the age of 75 in the United States with a correlation coefficient (R) of 0.321 and weighted average of 47.2%. Similarly, the statistical analysis conducted on geographies consisting of 512,333,705 people shows a moderate positive correlation between the proportion of Immigrants from Mexico and percentage of population with a disability over the age of 75 in the United States with a correlation coefficient (R) of 0.476 and weighted average of 51.1%, a difference of 8.3%.
Immigrants from Eastern Africa vs Immigrants from Mexico Disability Age Over 75

Disability Age Over 75 Correlation Summary

MeasurementImmigrants from Eastern AfricaImmigrants from Mexico
Minimum29.5%20.9%
Maximum86.5%100.0%
Range57.0%79.1%
Mean48.2%56.9%
Median47.2%53.0%
Interquartile 25% (IQ1)45.3%49.3%
Interquartile 75% (IQ3)50.0%57.6%
Interquartile Range (IQR)4.7%8.2%
Standard Deviation (Sample)8.3%15.9%
Standard Deviation (Population)8.2%15.9%

Similar Demographics by Disability Age Over 75

Demographics Similar to Immigrants from Eastern Africa by Disability Age Over 75

In terms of disability age over 75, the demographic groups most similar to Immigrants from Eastern Africa are Pennsylvania German (47.2%, a difference of 0.010%), French (47.2%, a difference of 0.020%), Immigrants from Zimbabwe (47.2%, a difference of 0.030%), Immigrants from Sierra Leone (47.2%, a difference of 0.030%), and Immigrants from Middle Africa (47.1%, a difference of 0.070%).
DemographicsRating | RankDisability Age Over 75
Arabs
73.3
/100
|
#156
Good
47.1%
Bhutanese
72.6
/100
|
#157
Good
47.1%
Immigrants | Guyana
71.9
/100
|
#158
Good
47.1%
Immigrants | Morocco
71.4
/100
|
#159
Good
47.1%
Immigrants | Middle Africa
68.3
/100
|
#160
Good
47.1%
South American Indians
68.1
/100
|
#161
Good
47.1%
Pennsylvania Germans
66.0
/100
|
#162
Good
47.2%
Immigrants | Eastern Africa
65.5
/100
|
#163
Good
47.2%
French
64.6
/100
|
#164
Good
47.2%
Immigrants | Zimbabwe
64.4
/100
|
#165
Good
47.2%
Immigrants | Sierra Leone
64.4
/100
|
#166
Good
47.2%
Moroccans
62.9
/100
|
#167
Good
47.2%
Kenyans
58.8
/100
|
#168
Average
47.2%
Celtics
58.7
/100
|
#169
Average
47.2%
German Russians
56.2
/100
|
#170
Average
47.3%

Demographics Similar to Immigrants from Mexico by Disability Age Over 75

In terms of disability age over 75, the demographic groups most similar to Immigrants from Mexico are Mexican (51.1%, a difference of 0.050%), Chickasaw (51.2%, a difference of 0.19%), Immigrants from the Azores (50.9%, a difference of 0.37%), Yakama (51.3%, a difference of 0.37%), and Cheyenne (50.9%, a difference of 0.42%).
DemographicsRating | RankDisability Age Over 75
Immigrants | Fiji
0.0
/100
|
#307
Tragic
50.6%
Hispanics or Latinos
0.0
/100
|
#308
Tragic
50.6%
Aleuts
0.0
/100
|
#309
Tragic
50.6%
Tlingit-Haida
0.0
/100
|
#310
Tragic
50.6%
Cajuns
0.0
/100
|
#311
Tragic
50.7%
Cheyenne
0.0
/100
|
#312
Tragic
50.9%
Immigrants | Azores
0.0
/100
|
#313
Tragic
50.9%
Immigrants | Mexico
0.0
/100
|
#314
Tragic
51.1%
Mexicans
0.0
/100
|
#315
Tragic
51.1%
Chickasaw
0.0
/100
|
#316
Tragic
51.2%
Yakama
0.0
/100
|
#317
Tragic
51.3%
Seminole
0.0
/100
|
#318
Tragic
51.5%
Creek
0.0
/100
|
#319
Tragic
51.5%
Paiute
0.0
/100
|
#320
Tragic
51.5%
Dutch West Indians
0.0
/100
|
#321
Tragic
51.5%