Immigrants from Colombia vs Immigrants from Sudan Hearing Disability

COMPARE

Immigrants from Colombia
Race
Ancestry
AfghanAfricanAlaska NativeAlaskan AthabascanAlbanianAleutAlsatianAmericanApacheArabArapahoArgentineanArmenianAssyrian/Chaldean/SyriacAustralianAustrianBahamianBangladeshiBarbadianBasqueBelgianBelizeanBermudanBhutaneseBlackfeetBolivianBrazilianBritishBritish West IndianBulgarianBurmeseCajunCambodianCanadianCape VerdeanCarpatho RusynCelticCentral AmericanCentral American IndianCherokeeCheyenneChickasawChileanChineseChippewaChoctawColombianColvilleComancheCosta RicanCreeCreekCroatianCrowCubanCypriotCzechCzechoslovakianDanishDelawareDominicanDutchDutch West IndianEastern EuropeanEcuadorianEgyptianEnglishEstonianEthiopianEuropeanFijianFilipinoFinnishFrenchFrench American IndianFrench CanadianGermanGerman RussianGhanaianGreekGuamanian/ChamorroGuatemalanGuyaneseHaitianHmongHonduranHopiHoumaHungarianIcelanderIndian (Asian)IndonesianInupiatIranianIraqiIrishIroquoisIsraeliItalianJamaicanJapaneseJordanianKenyanKiowaKoreanLaotianLatvianLebaneseLiberianLithuanianLumbeeLuxembourgerMacedonianMalaysianMalteseMarshalleseMenomineeMexicanMexican American IndianMongolianMoroccanNative HawaiianNavajoNepaleseNew ZealanderNicaraguanNigerianNorthern EuropeanNorwegianOkinawanOsageOttawaPaiutePakistaniPalestinianPanamanianParaguayanPennsylvania GermanPeruvianPimaPolishPortuguesePotawatomiPuebloPuerto RicanPuget Sound SalishRomanianRussianSalvadoranSamoanScandinavianScotch-IrishScottishSeminoleSenegaleseSerbianShoshoneSierra LeoneanSiouxSlavicSlovakSloveneSomaliSouth AfricanSouth AmericanSouth American IndianSoviet UnionSpaniardSpanishSpanish AmericanSpanish American IndianSri LankanSubsaharan AfricanSudaneseSwedishSwissSyrianTaiwaneseThaiTlingit-HaidaTohono O'OdhamTonganTrinidadian and TobagonianTsimshianTurkishU.S. Virgin IslanderUgandanUkrainianUruguayanUteVenezuelanVietnameseWelshWest IndianYakamaYaquiYugoslavianYumanYup'ikZimbabwean
Immigration
NonimmigrantsImmigrantsAfghanistanAfricaAlbaniaArgentinaArmeniaAsiaAustraliaAustriaBahamasBangladeshBarbadosBelarusBelgiumBelizeBoliviaBosnia and HerzegovinaBrazilBulgariaBurma/MyanmarCabo VerdeCambodiaCameroonCanadaCaribbeanCentral AmericaChileChinaColombiaCongoCosta RicaCroatiaCubaCzechoslovakiaDenmarkDominicaDominican RepublicEastern AfricaEastern AsiaEastern EuropeEcuadorEgyptEl SalvadorEnglandEritreaEthiopiaEuropeFijiFranceGermanyGhanaGreeceGrenadaGuatemalaGuyanaHaitiHondurasHong KongHungaryIndiaIndonesiaIranIraqIrelandIsraelItalyJamaicaJapanJordanKazakhstanKenyaKoreaKuwaitLaosLatin AmericaLatviaLebanonLiberiaLithuaniaMalaysiaMexicoMicronesiaMiddle AfricaMoldovaMoroccoNepalNetherlandsNicaraguaNigeriaNorth AmericaNorth MacedoniaNorthern AfricaNorthern EuropeNorwayOceaniaPakistanPanamaPeruPhilippinesPolandPortugalRomaniaRussiaSaudi ArabiaScotlandSenegalSerbiaSierra LeoneSingaporeSomaliaSouth AfricaSouth AmericaSouth Central AsiaSouth Eastern AsiaSouthern EuropeSpainSri LankaSt. Vincent and the GrenadinesSwedenSwitzerlandSyriaTaiwanThailandTrinidad and TobagoTurkeyUgandaUkraineUruguayUzbekistanVenezuelaVietnamWest IndiesWestern AfricaWestern AsiaWestern EuropeYemenZaireZimbabweAzores
Immigrants from Sudan
Race
Ancestry
AfghanAfricanAlaska NativeAlaskan AthabascanAlbanianAleutAlsatianAmericanApacheArabArapahoArgentineanArmenianAssyrian/Chaldean/SyriacAustralianAustrianBahamianBangladeshiBarbadianBasqueBelgianBelizeanBermudanBhutaneseBlackfeetBolivianBrazilianBritishBritish West IndianBulgarianBurmeseCajunCambodianCanadianCape VerdeanCarpatho RusynCelticCentral AmericanCentral American IndianCherokeeCheyenneChickasawChileanChineseChippewaChoctawColombianColvilleComancheCosta RicanCreeCreekCroatianCrowCubanCypriotCzechCzechoslovakianDanishDelawareDominicanDutchDutch West IndianEastern EuropeanEcuadorianEgyptianEnglishEstonianEthiopianEuropeanFijianFilipinoFinnishFrenchFrench American IndianFrench CanadianGermanGerman RussianGhanaianGreekGuamanian/ChamorroGuatemalanGuyaneseHaitianHmongHonduranHopiHoumaHungarianIcelanderIndian (Asian)IndonesianInupiatIranianIraqiIrishIroquoisIsraeliItalianJamaicanJapaneseJordanianKenyanKiowaKoreanLaotianLatvianLebaneseLiberianLithuanianLumbeeLuxembourgerMacedonianMalaysianMalteseMarshalleseMenomineeMexicanMexican American IndianMongolianMoroccanNative HawaiianNavajoNepaleseNew ZealanderNicaraguanNigerianNorthern EuropeanNorwegianOkinawanOsageOttawaPaiutePakistaniPalestinianPanamanianParaguayanPennsylvania GermanPeruvianPimaPolishPortuguesePotawatomiPuebloPuerto RicanPuget Sound SalishRomanianRussianSalvadoranSamoanScandinavianScotch-IrishScottishSeminoleSenegaleseSerbianShoshoneSierra LeoneanSiouxSlavicSlovakSloveneSomaliSouth AfricanSouth AmericanSouth American IndianSoviet UnionSpaniardSpanishSpanish AmericanSpanish American IndianSri LankanSubsaharan AfricanSudaneseSwedishSwissSyrianTaiwaneseThaiTlingit-HaidaTohono O'OdhamTonganTrinidadian and TobagonianTsimshianTurkishU.S. Virgin IslanderUgandanUkrainianUruguayanUteVenezuelanVietnameseWelshWest IndianYakamaYaquiYugoslavianYumanYup'ikZimbabwean
Immigration
NonimmigrantsImmigrantsAfghanistanAfricaAlbaniaArgentinaArmeniaAsiaAustraliaAustriaBahamasBangladeshBarbadosBelarusBelgiumBelizeBoliviaBosnia and HerzegovinaBrazilBulgariaBurma/MyanmarCabo VerdeCambodiaCameroonCanadaCaribbeanCentral AmericaChileChinaCongoCosta RicaCroatiaCubaCzechoslovakiaDenmarkDominicaDominican RepublicEastern AfricaEastern AsiaEastern EuropeEcuadorEgyptEl SalvadorEnglandEritreaEthiopiaEuropeFijiFranceGermanyGhanaGreeceGrenadaGuatemalaGuyanaHaitiHondurasHong KongHungaryIndiaIndonesiaIranIraqIrelandIsraelItalyJamaicaJapanJordanKazakhstanKenyaKoreaKuwaitLaosLatin AmericaLatviaLebanonLiberiaLithuaniaMalaysiaMexicoMicronesiaMiddle AfricaMoldovaMoroccoNepalNetherlandsNicaraguaNigeriaNorth AmericaNorth MacedoniaNorthern AfricaNorthern EuropeNorwayOceaniaPakistanPanamaPeruPhilippinesPolandPortugalRomaniaRussiaSaudi ArabiaScotlandSenegalSerbiaSierra LeoneSingaporeSomaliaSouth AfricaSouth AmericaSouth Central AsiaSouth Eastern AsiaSouthern EuropeSpainSri LankaSt. Vincent and the GrenadinesSudanSwedenSwitzerlandSyriaTaiwanThailandTrinidad and TobagoTurkeyUgandaUkraineUruguayUzbekistanVenezuelaVietnamWest IndiesWestern AfricaWestern AsiaWestern EuropeYemenZaireZimbabweAzores
Hearing Disability
Income
Poverty
Unemployment
Labor Participation
Family Structure
Vehicle Availability
Education Level
Disability

Hearing Disability Comparison

Immigrants from Colombia

Immigrants from Sudan

Exceptional
Excellent
2.7%
HEARING DISABILITY
98.4/ 100
METRIC RATING
62nd/ 347
METRIC RANK
2.9%
HEARING DISABILITY
87.8/ 100
METRIC RATING
126th/ 347
METRIC RANK

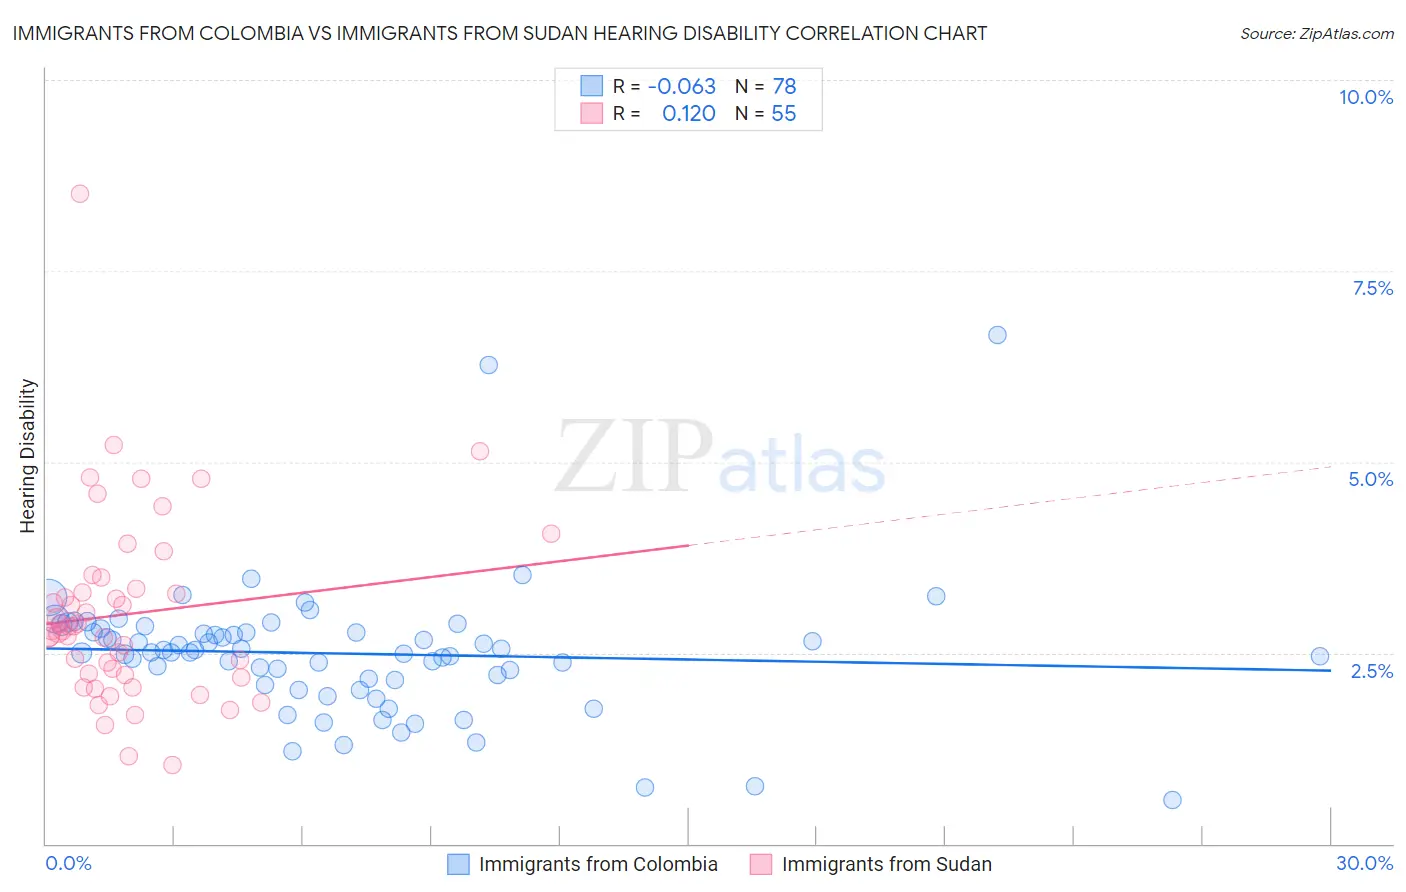
Immigrants from Colombia vs Immigrants from Sudan Hearing Disability Correlation Chart

The statistical analysis conducted on geographies consisting of 378,548,694 people shows a slight negative correlation between the proportion of Immigrants from Colombia and percentage of population with hearing disability in the United States with a correlation coefficient (R) of -0.063 and weighted average of 2.7%. Similarly, the statistical analysis conducted on geographies consisting of 118,954,451 people shows a poor positive correlation between the proportion of Immigrants from Sudan and percentage of population with hearing disability in the United States with a correlation coefficient (R) of 0.120 and weighted average of 2.9%, a difference of 5.6%.
Immigrants from Colombia vs Immigrants from Sudan Hearing Disability

Hearing Disability Correlation Summary

MeasurementImmigrants from ColombiaImmigrants from Sudan
Minimum0.57%1.0%
Maximum6.7%8.5%
Range6.1%7.5%
Mean2.5%3.0%
Median2.5%2.8%
Interquartile 25% (IQ1)2.1%2.2%
Interquartile 75% (IQ3)2.8%3.3%
Interquartile Range (IQR)0.62%1.1%
Standard Deviation (Sample)0.89%1.2%
Standard Deviation (Population)0.88%1.2%

Similar Demographics by Hearing Disability

Demographics Similar to Immigrants from Colombia by Hearing Disability

In terms of hearing disability, the demographic groups most similar to Immigrants from Colombia are Immigrants from Uzbekistan (2.7%, a difference of 0.0%), Indian (Asian) (2.7%, a difference of 0.050%), Immigrants from Sri Lanka (2.7%, a difference of 0.11%), Immigrants from Egypt (2.7%, a difference of 0.14%), and Immigrants from Nepal (2.7%, a difference of 0.19%).
DemographicsRating | RankHearing Disability
Immigrants | Ethiopia
99.0
/100
|
#55
Exceptional
2.7%
Immigrants | Nicaragua
99.0
/100
|
#56
Exceptional
2.7%
South Americans
99.0
/100
|
#57
Exceptional
2.7%
Immigrants | Peru
98.6
/100
|
#58
Exceptional
2.7%
Immigrants | Eritrea
98.5
/100
|
#59
Exceptional
2.7%
Immigrants | Egypt
98.5
/100
|
#60
Exceptional
2.7%
Immigrants | Uzbekistan
98.4
/100
|
#61
Exceptional
2.7%
Immigrants | Colombia
98.4
/100
|
#62
Exceptional
2.7%
Indians (Asian)
98.4
/100
|
#63
Exceptional
2.7%
Immigrants | Sri Lanka
98.4
/100
|
#64
Exceptional
2.7%
Immigrants | Nepal
98.3
/100
|
#65
Exceptional
2.7%
Immigrants | Belize
98.2
/100
|
#66
Exceptional
2.7%
Egyptians
98.1
/100
|
#67
Exceptional
2.7%
Immigrants | Africa
98.0
/100
|
#68
Exceptional
2.7%
Nicaraguans
97.9
/100
|
#69
Exceptional
2.7%

Demographics Similar to Immigrants from Sudan by Hearing Disability

In terms of hearing disability, the demographic groups most similar to Immigrants from Sudan are Immigrants from Albania (2.9%, a difference of 0.16%), Immigrants from Zaire (2.9%, a difference of 0.19%), Bahamian (2.9%, a difference of 0.19%), South American Indian (2.9%, a difference of 0.22%), and Immigrants from Western Asia (2.9%, a difference of 0.22%).
DemographicsRating | RankHearing Disability
Kenyans
89.8
/100
|
#119
Excellent
2.8%
Jordanians
89.5
/100
|
#120
Excellent
2.8%
Cubans
89.4
/100
|
#121
Excellent
2.8%
Liberians
89.0
/100
|
#122
Excellent
2.8%
Immigrants | Zaire
88.6
/100
|
#123
Excellent
2.9%
Bahamians
88.6
/100
|
#124
Excellent
2.9%
Immigrants | Albania
88.5
/100
|
#125
Excellent
2.9%
Immigrants | Sudan
87.8
/100
|
#126
Excellent
2.9%
South American Indians
86.9
/100
|
#127
Excellent
2.9%
Immigrants | Western Asia
86.9
/100
|
#128
Excellent
2.9%
Immigrants | Uganda
86.6
/100
|
#129
Excellent
2.9%
Immigrants | Vietnam
86.5
/100
|
#130
Excellent
2.9%
Immigrants | Kenya
86.1
/100
|
#131
Excellent
2.9%
Chileans
85.8
/100
|
#132
Excellent
2.9%
Immigrants | Syria
85.8
/100
|
#133
Excellent
2.9%