Immigrants from Cambodia vs Egyptian Disability Age 35 to 64
COMPARE
Immigrants from Cambodia
Egyptian
Disability Age 35 to 64
Disability Age 35 to 64 Comparison
Immigrants from Cambodia
Egyptians
12.0%
DISABILITY AGE 35 TO 64
3.9/ 100
METRIC RATING
237th/ 347
METRIC RANK
9.7%
DISABILITY AGE 35 TO 64
99.9/ 100
METRIC RATING
38th/ 347
METRIC RANK
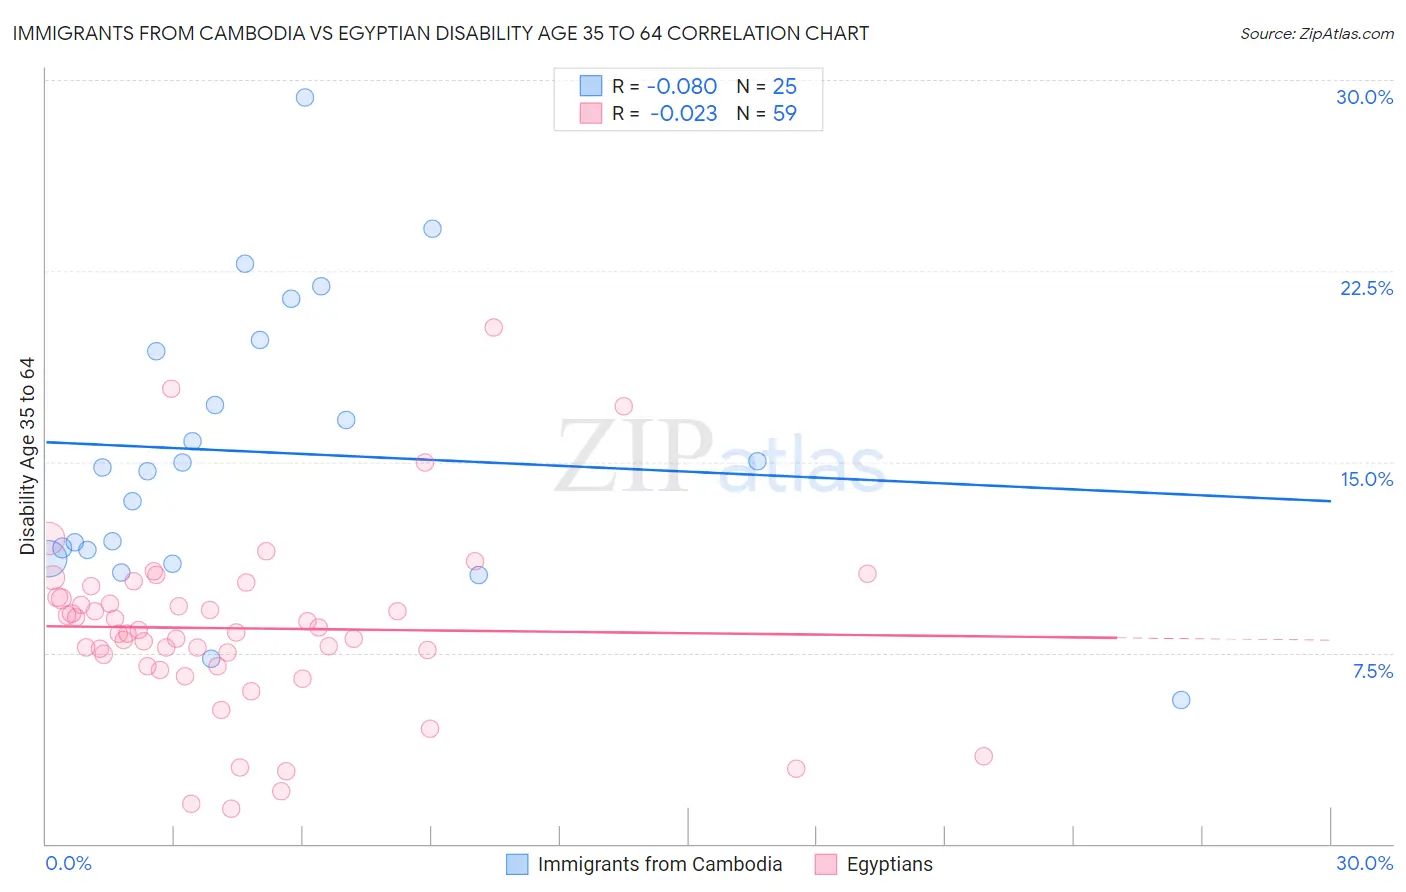
Immigrants from Cambodia vs Egyptian Disability Age 35 to 64 Correlation Chart
The statistical analysis conducted on geographies consisting of 205,109,401 people shows a slight negative correlation between the proportion of Immigrants from Cambodia and percentage of population with a disability between the ages 34 and 64 in the United States with a correlation coefficient (R) of -0.080 and weighted average of 12.0%. Similarly, the statistical analysis conducted on geographies consisting of 276,747,097 people shows no correlation between the proportion of Egyptians and percentage of population with a disability between the ages 34 and 64 in the United States with a correlation coefficient (R) of -0.023 and weighted average of 9.7%, a difference of 23.7%.
Disability Age 35 to 64 Correlation Summary
| Measurement | Immigrants from Cambodia | Egyptian |
| Minimum | 5.7% | 1.4% |
| Maximum | 29.3% | 20.3% |
| Range | 23.6% | 18.9% |
| Mean | 15.4% | 8.5% |
| Median | 14.8% | 8.3% |
| Interquartile 25% (IQ1) | 11.4% | 7.0% |
| Interquartile 75% (IQ3) | 19.6% | 9.7% |
| Interquartile Range (IQR) | 8.2% | 2.7% |
| Standard Deviation (Sample) | 5.6% | 3.5% |
| Standard Deviation (Population) | 5.5% | 3.5% |
Similar Demographics by Disability Age 35 to 64
Demographics Similar to Immigrants from Cambodia by Disability Age 35 to 64
In terms of disability age 35 to 64, the demographic groups most similar to Immigrants from Cambodia are West Indian (12.0%, a difference of 0.10%), Immigrants from Middle Africa (12.0%, a difference of 0.26%), Belizean (12.0%, a difference of 0.28%), Immigrants from Western Africa (12.0%, a difference of 0.36%), and Immigrants from Thailand (12.0%, a difference of 0.37%).
| Demographics | Rating | Rank | Disability Age 35 to 64 |
| Panamanians | 5.8 /100 | #230 | Tragic 11.9% |
| Jamaicans | 5.7 /100 | #231 | Tragic 11.9% |
| Sudanese | 5.3 /100 | #232 | Tragic 11.9% |
| Bermudans | 5.0 /100 | #233 | Tragic 11.9% |
| Portuguese | 4.9 /100 | #234 | Tragic 11.9% |
| Belizeans | 4.5 /100 | #235 | Tragic 12.0% |
| Immigrants | Middle Africa | 4.5 /100 | #236 | Tragic 12.0% |
| Immigrants | Cambodia | 3.9 /100 | #237 | Tragic 12.0% |
| West Indians | 3.7 /100 | #238 | Tragic 12.0% |
| Immigrants | Western Africa | 3.3 /100 | #239 | Tragic 12.0% |
| Immigrants | Thailand | 3.3 /100 | #240 | Tragic 12.0% |
| Mexican American Indians | 3.2 /100 | #241 | Tragic 12.0% |
| Samoans | 2.8 /100 | #242 | Tragic 12.1% |
| Slovaks | 2.7 /100 | #243 | Tragic 12.1% |
| Finns | 2.3 /100 | #244 | Tragic 12.1% |
Demographics Similar to Egyptians by Disability Age 35 to 64
In terms of disability age 35 to 64, the demographic groups most similar to Egyptians are Immigrants from Turkey (9.7%, a difference of 0.070%), Immigrants from Cuba (9.7%, a difference of 0.15%), Immigrants from Belarus (9.7%, a difference of 0.17%), Bulgarian (9.7%, a difference of 0.18%), and Immigrants from Armenia (9.7%, a difference of 0.23%).
| Demographics | Rating | Rank | Disability Age 35 to 64 |
| Immigrants | Lithuania | 99.9 /100 | #31 | Exceptional 9.6% |
| Turks | 99.9 /100 | #32 | Exceptional 9.7% |
| Immigrants | Indonesia | 99.9 /100 | #33 | Exceptional 9.7% |
| Immigrants | Australia | 99.9 /100 | #34 | Exceptional 9.7% |
| Bulgarians | 99.9 /100 | #35 | Exceptional 9.7% |
| Immigrants | Cuba | 99.9 /100 | #36 | Exceptional 9.7% |
| Immigrants | Turkey | 99.9 /100 | #37 | Exceptional 9.7% |
| Egyptians | 99.9 /100 | #38 | Exceptional 9.7% |
| Immigrants | Belarus | 99.9 /100 | #39 | Exceptional 9.7% |
| Immigrants | Armenia | 99.9 /100 | #40 | Exceptional 9.7% |
| Israelis | 99.9 /100 | #41 | Exceptional 9.7% |
| Immigrants | Malaysia | 99.9 /100 | #42 | Exceptional 9.7% |
| Immigrants | Colombia | 99.9 /100 | #43 | Exceptional 9.8% |
| Immigrants | Egypt | 99.9 /100 | #44 | Exceptional 9.8% |
| Immigrants | Peru | 99.9 /100 | #45 | Exceptional 9.8% |