Immigrants from Bolivia vs Immigrants from Northern Europe Vision Disability
COMPARE
Immigrants from Bolivia
Immigrants from Northern Europe
Vision Disability
Vision Disability Comparison
Immigrants from Bolivia
Immigrants from Northern Europe
1.8%
VISION DISABILITY
100.0/ 100
METRIC RATING
15th/ 347
METRIC RANK
2.0%
VISION DISABILITY
98.6/ 100
METRIC RATING
71st/ 347
METRIC RANK
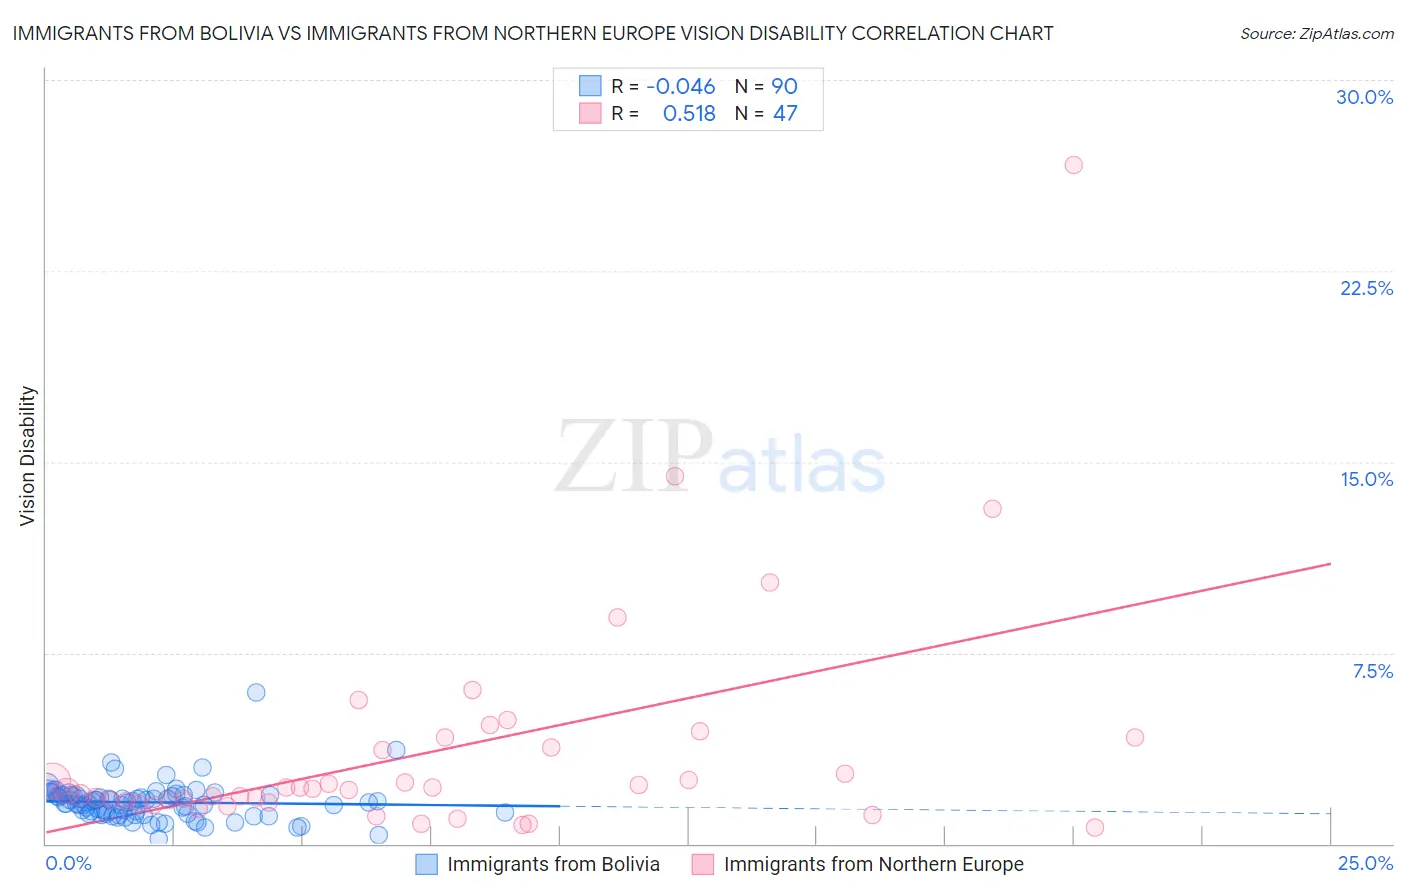
Immigrants from Bolivia vs Immigrants from Northern Europe Vision Disability Correlation Chart
The statistical analysis conducted on geographies consisting of 158,695,494 people shows no correlation between the proportion of Immigrants from Bolivia and percentage of population with vision disability in the United States with a correlation coefficient (R) of -0.046 and weighted average of 1.8%. Similarly, the statistical analysis conducted on geographies consisting of 476,530,076 people shows a substantial positive correlation between the proportion of Immigrants from Northern Europe and percentage of population with vision disability in the United States with a correlation coefficient (R) of 0.518 and weighted average of 2.0%, a difference of 9.8%.
Vision Disability Correlation Summary
| Measurement | Immigrants from Bolivia | Immigrants from Northern Europe |
| Minimum | 0.21% | 0.66% |
| Maximum | 5.9% | 26.7% |
| Range | 5.7% | 26.0% |
| Mean | 1.6% | 3.7% |
| Median | 1.6% | 2.2% |
| Interquartile 25% (IQ1) | 1.2% | 1.6% |
| Interquartile 75% (IQ3) | 1.9% | 4.2% |
| Interquartile Range (IQR) | 0.72% | 2.5% |
| Standard Deviation (Sample) | 0.74% | 4.5% |
| Standard Deviation (Population) | 0.74% | 4.5% |
Similar Demographics by Vision Disability
Demographics Similar to Immigrants from Bolivia by Vision Disability
In terms of vision disability, the demographic groups most similar to Immigrants from Bolivia are Immigrants from China (1.8%, a difference of 0.42%), Indian (Asian) (1.8%, a difference of 0.44%), Burmese (1.8%, a difference of 0.45%), Immigrants from Eastern Asia (1.8%, a difference of 0.57%), and Immigrants from Korea (1.8%, a difference of 0.65%).
| Demographics | Rating | Rank | Vision Disability |
| Iranians | 100.0 /100 | #8 | Exceptional 1.8% |
| Immigrants | Singapore | 100.0 /100 | #9 | Exceptional 1.8% |
| Immigrants | Hong Kong | 100.0 /100 | #10 | Exceptional 1.8% |
| Immigrants | Israel | 100.0 /100 | #11 | Exceptional 1.8% |
| Immigrants | Korea | 100.0 /100 | #12 | Exceptional 1.8% |
| Immigrants | Eastern Asia | 100.0 /100 | #13 | Exceptional 1.8% |
| Immigrants | China | 100.0 /100 | #14 | Exceptional 1.8% |
| Immigrants | Bolivia | 100.0 /100 | #15 | Exceptional 1.8% |
| Indians (Asian) | 100.0 /100 | #16 | Exceptional 1.8% |
| Burmese | 100.0 /100 | #17 | Exceptional 1.8% |
| Bolivians | 100.0 /100 | #18 | Exceptional 1.9% |
| Immigrants | Sri Lanka | 100.0 /100 | #19 | Exceptional 1.9% |
| Asians | 100.0 /100 | #20 | Exceptional 1.9% |
| Turks | 100.0 /100 | #21 | Exceptional 1.9% |
| Immigrants | Pakistan | 100.0 /100 | #22 | Exceptional 1.9% |
Demographics Similar to Immigrants from Northern Europe by Vision Disability
In terms of vision disability, the demographic groups most similar to Immigrants from Northern Europe are Immigrants from Kazakhstan (2.0%, a difference of 0.010%), Russian (2.0%, a difference of 0.030%), Immigrants from France (2.0%, a difference of 0.050%), Immigrants from Czechoslovakia (2.0%, a difference of 0.20%), and Immigrants from Eritrea (2.0%, a difference of 0.25%).
| Demographics | Rating | Rank | Vision Disability |
| Immigrants | Greece | 99.0 /100 | #64 | Exceptional 2.0% |
| Maltese | 98.9 /100 | #65 | Exceptional 2.0% |
| Immigrants | Argentina | 98.9 /100 | #66 | Exceptional 2.0% |
| Immigrants | Northern Africa | 98.8 /100 | #67 | Exceptional 2.0% |
| Immigrants | Czechoslovakia | 98.7 /100 | #68 | Exceptional 2.0% |
| Russians | 98.6 /100 | #69 | Exceptional 2.0% |
| Immigrants | Kazakhstan | 98.6 /100 | #70 | Exceptional 2.0% |
| Immigrants | Northern Europe | 98.6 /100 | #71 | Exceptional 2.0% |
| Immigrants | France | 98.5 /100 | #72 | Exceptional 2.0% |
| Immigrants | Eritrea | 98.4 /100 | #73 | Exceptional 2.0% |
| Palestinians | 98.3 /100 | #74 | Exceptional 2.0% |
| Immigrants | North Macedonia | 98.3 /100 | #75 | Exceptional 2.0% |
| Paraguayans | 98.3 /100 | #76 | Exceptional 2.0% |
| Immigrants | Jordan | 98.3 /100 | #77 | Exceptional 2.0% |
| Immigrants | Eastern Europe | 98.3 /100 | #78 | Exceptional 2.0% |