Immigrants from Belize vs Immigrants from Zimbabwe Disability Age Over 75
COMPARE
Immigrants from Belize
Immigrants from Zimbabwe
Disability Age Over 75
Disability Age Over 75 Comparison
Immigrants from Belize
Immigrants from Zimbabwe
49.6%
DISABILITY AGE OVER 75
0.0/ 100
METRIC RATING
286th/ 347
METRIC RANK
47.2%
DISABILITY AGE OVER 75
64.4/ 100
METRIC RATING
165th/ 347
METRIC RANK
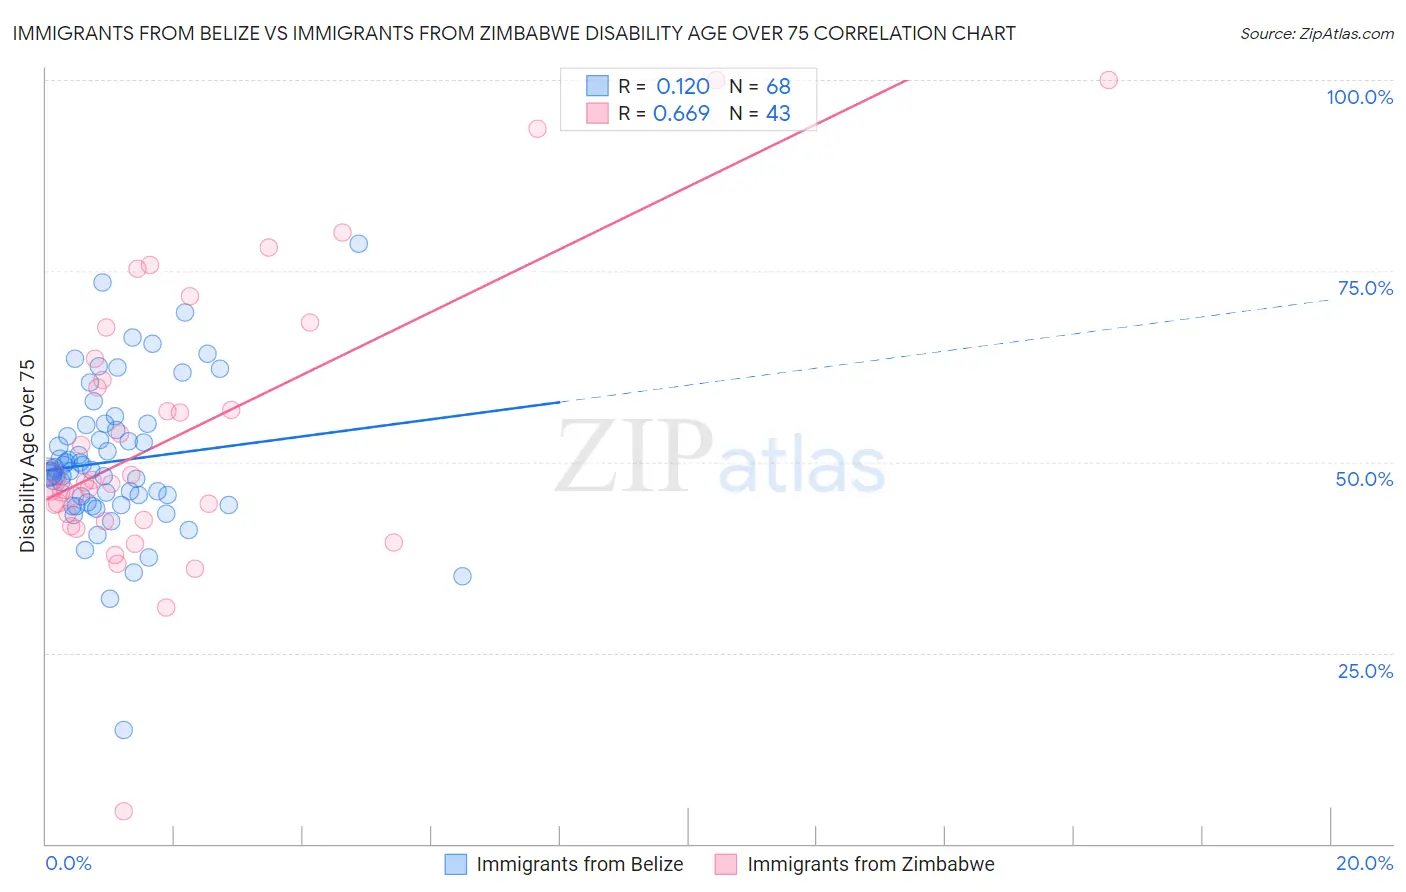
Immigrants from Belize vs Immigrants from Zimbabwe Disability Age Over 75 Correlation Chart
The statistical analysis conducted on geographies consisting of 130,240,779 people shows a poor positive correlation between the proportion of Immigrants from Belize and percentage of population with a disability over the age of 75 in the United States with a correlation coefficient (R) of 0.120 and weighted average of 49.6%. Similarly, the statistical analysis conducted on geographies consisting of 117,713,093 people shows a significant positive correlation between the proportion of Immigrants from Zimbabwe and percentage of population with a disability over the age of 75 in the United States with a correlation coefficient (R) of 0.669 and weighted average of 47.2%, a difference of 5.2%.
Disability Age Over 75 Correlation Summary
| Measurement | Immigrants from Belize | Immigrants from Zimbabwe |
| Minimum | 14.9% | 4.3% |
| Maximum | 78.6% | 100.0% |
| Range | 63.7% | 95.7% |
| Mean | 50.1% | 53.7% |
| Median | 48.8% | 47.3% |
| Interquartile 25% (IQ1) | 44.5% | 42.4% |
| Interquartile 75% (IQ3) | 54.5% | 63.4% |
| Interquartile Range (IQR) | 10.0% | 21.0% |
| Standard Deviation (Sample) | 9.9% | 18.7% |
| Standard Deviation (Population) | 9.8% | 18.5% |
Similar Demographics by Disability Age Over 75
Demographics Similar to Immigrants from Belize by Disability Age Over 75
In terms of disability age over 75, the demographic groups most similar to Immigrants from Belize are Crow (49.6%, a difference of 0.080%), Sioux (49.7%, a difference of 0.21%), Immigrants from Latin America (49.5%, a difference of 0.22%), Yaqui (49.8%, a difference of 0.26%), and Samoan (49.5%, a difference of 0.27%).
| Demographics | Rating | Rank | Disability Age Over 75 |
| Guamanians/Chamorros | 0.0 /100 | #279 | Tragic 49.4% |
| Bangladeshis | 0.0 /100 | #280 | Tragic 49.4% |
| Belizeans | 0.0 /100 | #281 | Tragic 49.4% |
| Blacks/African Americans | 0.0 /100 | #282 | Tragic 49.5% |
| Samoans | 0.0 /100 | #283 | Tragic 49.5% |
| Immigrants | Latin America | 0.0 /100 | #284 | Tragic 49.5% |
| Crow | 0.0 /100 | #285 | Tragic 49.6% |
| Immigrants | Belize | 0.0 /100 | #286 | Tragic 49.6% |
| Sioux | 0.0 /100 | #287 | Tragic 49.7% |
| Yaqui | 0.0 /100 | #288 | Tragic 49.8% |
| Osage | 0.0 /100 | #289 | Tragic 49.8% |
| Puget Sound Salish | 0.0 /100 | #290 | Tragic 49.8% |
| Arapaho | 0.0 /100 | #291 | Tragic 49.8% |
| Shoshone | 0.0 /100 | #292 | Tragic 49.9% |
| Spanish American Indians | 0.0 /100 | #293 | Tragic 49.9% |
Demographics Similar to Immigrants from Zimbabwe by Disability Age Over 75
In terms of disability age over 75, the demographic groups most similar to Immigrants from Zimbabwe are French (47.2%, a difference of 0.0%), Immigrants from Sierra Leone (47.2%, a difference of 0.0%), Immigrants from Eastern Africa (47.2%, a difference of 0.030%), Pennsylvania German (47.2%, a difference of 0.040%), and Moroccan (47.2%, a difference of 0.040%).
| Demographics | Rating | Rank | Disability Age Over 75 |
| Immigrants | Guyana | 71.9 /100 | #158 | Good 47.1% |
| Immigrants | Morocco | 71.4 /100 | #159 | Good 47.1% |
| Immigrants | Middle Africa | 68.3 /100 | #160 | Good 47.1% |
| South American Indians | 68.1 /100 | #161 | Good 47.1% |
| Pennsylvania Germans | 66.0 /100 | #162 | Good 47.2% |
| Immigrants | Eastern Africa | 65.5 /100 | #163 | Good 47.2% |
| French | 64.6 /100 | #164 | Good 47.2% |
| Immigrants | Zimbabwe | 64.4 /100 | #165 | Good 47.2% |
| Immigrants | Sierra Leone | 64.4 /100 | #166 | Good 47.2% |
| Moroccans | 62.9 /100 | #167 | Good 47.2% |
| Kenyans | 58.8 /100 | #168 | Average 47.2% |
| Celtics | 58.7 /100 | #169 | Average 47.2% |
| German Russians | 56.2 /100 | #170 | Average 47.3% |
| Immigrants | Africa | 53.6 /100 | #171 | Average 47.3% |
| Scotch-Irish | 52.5 /100 | #172 | Average 47.3% |