Immigrants from Austria vs Immigrants from Northern Europe Cognitive Disability
COMPARE
Immigrants from Austria
Immigrants from Northern Europe
Cognitive Disability
Cognitive Disability Comparison
Immigrants from Austria
Immigrants from Northern Europe
16.3%
COGNITIVE DISABILITY
100.0/ 100
METRIC RATING
14th/ 347
METRIC RANK
16.3%
COGNITIVE DISABILITY
100.0/ 100
METRIC RATING
18th/ 347
METRIC RANK
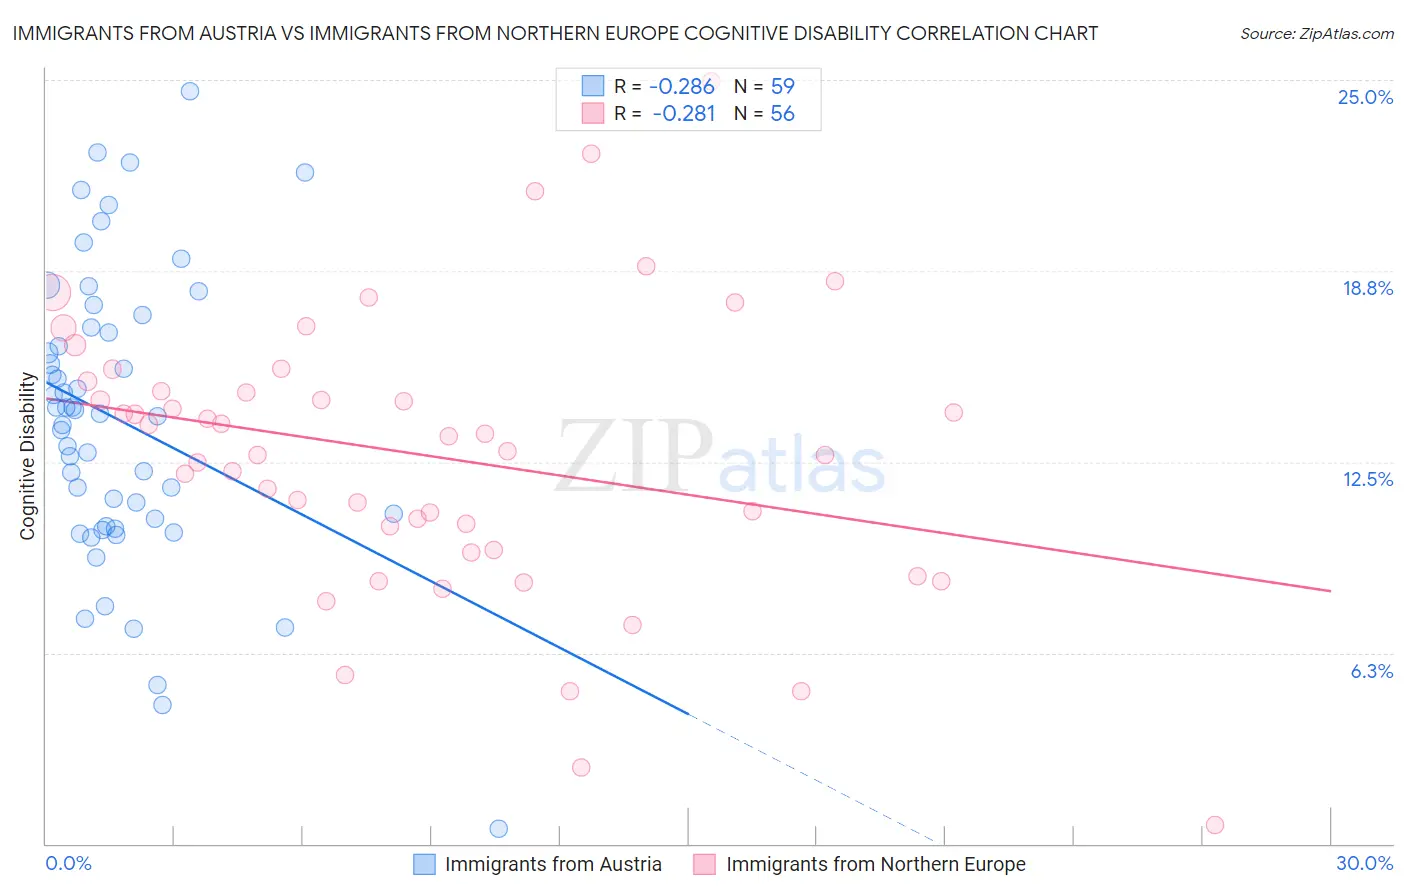
Immigrants from Austria vs Immigrants from Northern Europe Cognitive Disability Correlation Chart
The statistical analysis conducted on geographies consisting of 167,969,615 people shows a weak negative correlation between the proportion of Immigrants from Austria and percentage of population with cognitive disability in the United States with a correlation coefficient (R) of -0.286 and weighted average of 16.3%. Similarly, the statistical analysis conducted on geographies consisting of 477,209,929 people shows a weak negative correlation between the proportion of Immigrants from Northern Europe and percentage of population with cognitive disability in the United States with a correlation coefficient (R) of -0.281 and weighted average of 16.3%, a difference of 0.41%.
Cognitive Disability Correlation Summary
| Measurement | Immigrants from Austria | Immigrants from Northern Europe |
| Minimum | 0.49% | 0.61% |
| Maximum | 24.6% | 24.9% |
| Range | 24.1% | 24.3% |
| Mean | 13.9% | 12.7% |
| Median | 14.1% | 13.1% |
| Interquartile 25% (IQ1) | 10.4% | 10.0% |
| Interquartile 75% (IQ3) | 16.9% | 15.0% |
| Interquartile Range (IQR) | 6.5% | 5.0% |
| Standard Deviation (Sample) | 4.8% | 4.6% |
| Standard Deviation (Population) | 4.8% | 4.6% |
Demographics Similar to Immigrants from Austria and Immigrants from Northern Europe by Cognitive Disability
In terms of cognitive disability, the demographic groups most similar to Immigrants from Austria are Immigrants from Greece (16.3%, a difference of 0.030%), Lithuanian (16.3%, a difference of 0.060%), Maltese (16.2%, a difference of 0.15%), Immigrants from Czechoslovakia (16.2%, a difference of 0.31%), and Eastern European (16.3%, a difference of 0.33%). Similarly, the demographic groups most similar to Immigrants from Northern Europe are Immigrants from Bolivia (16.3%, a difference of 0.0%), Bulgarian (16.3%, a difference of 0.020%), Immigrants from North Macedonia (16.3%, a difference of 0.060%), Immigrants from Cuba (16.3%, a difference of 0.060%), and Eastern European (16.3%, a difference of 0.080%).
| Demographics | Rating | Rank | Cognitive Disability |
| Thais | 100.0 /100 | #6 | Exceptional 16.1% |
| Immigrants | Ireland | 100.0 /100 | #7 | Exceptional 16.1% |
| Immigrants | Poland | 100.0 /100 | #8 | Exceptional 16.1% |
| Assyrians/Chaldeans/Syriacs | 100.0 /100 | #9 | Exceptional 16.2% |
| Immigrants | Scotland | 100.0 /100 | #10 | Exceptional 16.2% |
| Immigrants | Czechoslovakia | 100.0 /100 | #11 | Exceptional 16.2% |
| Maltese | 100.0 /100 | #12 | Exceptional 16.2% |
| Lithuanians | 100.0 /100 | #13 | Exceptional 16.3% |
| Immigrants | Austria | 100.0 /100 | #14 | Exceptional 16.3% |
| Immigrants | Greece | 100.0 /100 | #15 | Exceptional 16.3% |
| Eastern Europeans | 100.0 /100 | #16 | Exceptional 16.3% |
| Immigrants | North Macedonia | 100.0 /100 | #17 | Exceptional 16.3% |
| Immigrants | Northern Europe | 100.0 /100 | #18 | Exceptional 16.3% |
| Immigrants | Bolivia | 100.0 /100 | #19 | Exceptional 16.3% |
| Bulgarians | 100.0 /100 | #20 | Exceptional 16.3% |
| Immigrants | Cuba | 100.0 /100 | #21 | Exceptional 16.3% |
| Immigrants | South Central Asia | 99.9 /100 | #22 | Exceptional 16.4% |
| Croatians | 99.9 /100 | #23 | Exceptional 16.4% |
| Immigrants | Argentina | 99.9 /100 | #24 | Exceptional 16.4% |
| Luxembourgers | 99.9 /100 | #25 | Exceptional 16.4% |
| Immigrants | Croatia | 99.9 /100 | #26 | Exceptional 16.4% |