Immigrants from Asia vs Immigrants from Australia Male Disability

COMPARE

Immigrants from Asia
Race
Ancestry
AfghanAfricanAlaska NativeAlaskan AthabascanAlbanianAleutAlsatianAmericanApacheArabArapahoArgentineanArmenianAssyrian/Chaldean/SyriacAustralianAustrianBahamianBangladeshiBarbadianBasqueBelgianBelizeanBermudanBhutaneseBlackfeetBolivianBrazilianBritishBritish West IndianBulgarianBurmeseCajunCambodianCanadianCape VerdeanCarpatho RusynCelticCentral AmericanCentral American IndianCherokeeCheyenneChickasawChileanChineseChippewaChoctawColombianColvilleComancheCosta RicanCreeCreekCroatianCrowCubanCypriotCzechCzechoslovakianDanishDelawareDominicanDutchDutch West IndianEastern EuropeanEcuadorianEgyptianEnglishEstonianEthiopianEuropeanFijianFilipinoFinnishFrenchFrench American IndianFrench CanadianGermanGerman RussianGhanaianGreekGuamanian/ChamorroGuatemalanGuyaneseHaitianHmongHonduranHopiHoumaHungarianIcelanderIndian (Asian)IndonesianInupiatIranianIraqiIrishIroquoisIsraeliItalianJamaicanJapaneseJordanianKenyanKiowaKoreanLaotianLatvianLebaneseLiberianLithuanianLumbeeLuxembourgerMacedonianMalaysianMalteseMarshalleseMenomineeMexicanMexican American IndianMongolianMoroccanNative HawaiianNavajoNepaleseNew ZealanderNicaraguanNigerianNorthern EuropeanNorwegianOkinawanOsageOttawaPaiutePakistaniPalestinianPanamanianParaguayanPennsylvania GermanPeruvianPimaPolishPortuguesePotawatomiPuebloPuerto RicanPuget Sound SalishRomanianRussianSalvadoranSamoanScandinavianScotch-IrishScottishSeminoleSenegaleseSerbianShoshoneSierra LeoneanSiouxSlavicSlovakSloveneSomaliSouth AfricanSouth AmericanSouth American IndianSoviet UnionSpaniardSpanishSpanish AmericanSpanish American IndianSri LankanSubsaharan AfricanSudaneseSwedishSwissSyrianTaiwaneseThaiTlingit-HaidaTohono O'OdhamTonganTrinidadian and TobagonianTsimshianTurkishU.S. Virgin IslanderUgandanUkrainianUruguayanUteVenezuelanVietnameseWelshWest IndianYakamaYaquiYugoslavianYumanYup'ikZimbabwean
Immigration
NonimmigrantsImmigrantsAfghanistanAfricaAlbaniaArgentinaArmeniaAsiaAustriaBahamasBangladeshBarbadosBelarusBelgiumBelizeBoliviaBosnia and HerzegovinaBrazilBulgariaBurma/MyanmarCabo VerdeCambodiaCameroonCanadaCaribbeanCentral AmericaChileChinaColombiaCongoCosta RicaCroatiaCubaCzechoslovakiaDenmarkDominicaDominican RepublicEastern AfricaEastern AsiaEastern EuropeEcuadorEgyptEl SalvadorEnglandEritreaEthiopiaEuropeFijiFranceGermanyGhanaGreeceGrenadaGuatemalaGuyanaHaitiHondurasHong KongHungaryIndiaIndonesiaIranIraqIrelandIsraelItalyJamaicaJapanJordanKazakhstanKenyaKoreaKuwaitLaosLatin AmericaLatviaLebanonLiberiaLithuaniaMalaysiaMexicoMicronesiaMiddle AfricaMoldovaMoroccoNepalNetherlandsNicaraguaNigeriaNorth AmericaNorth MacedoniaNorthern AfricaNorthern EuropeNorwayOceaniaPakistanPanamaPeruPhilippinesPolandPortugalRomaniaRussiaSaudi ArabiaScotlandSenegalSerbiaSierra LeoneSingaporeSomaliaSouth AfricaSouth AmericaSouth Central AsiaSouth Eastern AsiaSouthern EuropeSpainSri LankaSt. Vincent and the GrenadinesSudanSwedenSwitzerlandSyriaTaiwanThailandTrinidad and TobagoTurkeyUgandaUkraineUruguayUzbekistanVenezuelaVietnamWest IndiesWestern AfricaWestern AsiaWestern EuropeYemenZaireZimbabweAzores
Immigrants from Australia
Race
Ancestry
AfghanAfricanAlaska NativeAlaskan AthabascanAlbanianAleutAlsatianAmericanApacheArabArapahoArgentineanArmenianAssyrian/Chaldean/SyriacAustralianAustrianBahamianBangladeshiBarbadianBasqueBelgianBelizeanBermudanBhutaneseBlackfeetBolivianBrazilianBritishBritish West IndianBulgarianBurmeseCajunCambodianCanadianCape VerdeanCarpatho RusynCelticCentral AmericanCentral American IndianCherokeeCheyenneChickasawChileanChineseChippewaChoctawColombianColvilleComancheCosta RicanCreeCreekCroatianCrowCubanCypriotCzechCzechoslovakianDanishDelawareDominicanDutchDutch West IndianEastern EuropeanEcuadorianEgyptianEnglishEstonianEthiopianEuropeanFijianFilipinoFinnishFrenchFrench American IndianFrench CanadianGermanGerman RussianGhanaianGreekGuamanian/ChamorroGuatemalanGuyaneseHaitianHmongHonduranHopiHoumaHungarianIcelanderIndian (Asian)IndonesianInupiatIranianIraqiIrishIroquoisIsraeliItalianJamaicanJapaneseJordanianKenyanKiowaKoreanLaotianLatvianLebaneseLiberianLithuanianLumbeeLuxembourgerMacedonianMalaysianMalteseMarshalleseMenomineeMexicanMexican American IndianMongolianMoroccanNative HawaiianNavajoNepaleseNew ZealanderNicaraguanNigerianNorthern EuropeanNorwegianOkinawanOsageOttawaPaiutePakistaniPalestinianPanamanianParaguayanPennsylvania GermanPeruvianPimaPolishPortuguesePotawatomiPuebloPuerto RicanPuget Sound SalishRomanianRussianSalvadoranSamoanScandinavianScotch-IrishScottishSeminoleSenegaleseSerbianShoshoneSierra LeoneanSiouxSlavicSlovakSloveneSomaliSouth AfricanSouth AmericanSouth American IndianSoviet UnionSpaniardSpanishSpanish AmericanSpanish American IndianSri LankanSubsaharan AfricanSudaneseSwedishSwissSyrianTaiwaneseThaiTlingit-HaidaTohono O'OdhamTonganTrinidadian and TobagonianTsimshianTurkishU.S. Virgin IslanderUgandanUkrainianUruguayanUteVenezuelanVietnameseWelshWest IndianYakamaYaquiYugoslavianYumanYup'ikZimbabwean
Immigration
NonimmigrantsImmigrantsAfghanistanAfricaAlbaniaArgentinaArmeniaAustraliaAustriaBahamasBangladeshBarbadosBelarusBelgiumBelizeBoliviaBosnia and HerzegovinaBrazilBulgariaBurma/MyanmarCabo VerdeCambodiaCameroonCanadaCaribbeanCentral AmericaChileChinaColombiaCongoCosta RicaCroatiaCubaCzechoslovakiaDenmarkDominicaDominican RepublicEastern AfricaEastern AsiaEastern EuropeEcuadorEgyptEl SalvadorEnglandEritreaEthiopiaEuropeFijiFranceGermanyGhanaGreeceGrenadaGuatemalaGuyanaHaitiHondurasHong KongHungaryIndiaIndonesiaIranIraqIrelandIsraelItalyJamaicaJapanJordanKazakhstanKenyaKoreaKuwaitLaosLatin AmericaLatviaLebanonLiberiaLithuaniaMalaysiaMexicoMicronesiaMiddle AfricaMoldovaMoroccoNepalNetherlandsNicaraguaNigeriaNorth AmericaNorth MacedoniaNorthern AfricaNorthern EuropeNorwayOceaniaPakistanPanamaPeruPhilippinesPolandPortugalRomaniaRussiaSaudi ArabiaScotlandSenegalSerbiaSierra LeoneSingaporeSomaliaSouth AfricaSouth AmericaSouth Central AsiaSouth Eastern AsiaSouthern EuropeSpainSri LankaSt. Vincent and the GrenadinesSudanSwedenSwitzerlandSyriaTaiwanThailandTrinidad and TobagoTurkeyUgandaUkraineUruguayUzbekistanVenezuelaVietnamWest IndiesWestern AfricaWestern AsiaWestern EuropeYemenZaireZimbabweAzores
Male Disability
Income
Poverty
Unemployment
Labor Participation
Family Structure
Vehicle Availability
Education Level
Disability

Male Disability Comparison

Immigrants from Asia

Immigrants from Australia

Exceptional
Exceptional
10.0%
MALE DISABILITY
100.0/ 100
METRIC RATING
24th/ 347
METRIC RANK
10.4%
MALE DISABILITY
99.5/ 100
METRIC RATING
59th/ 347
METRIC RANK

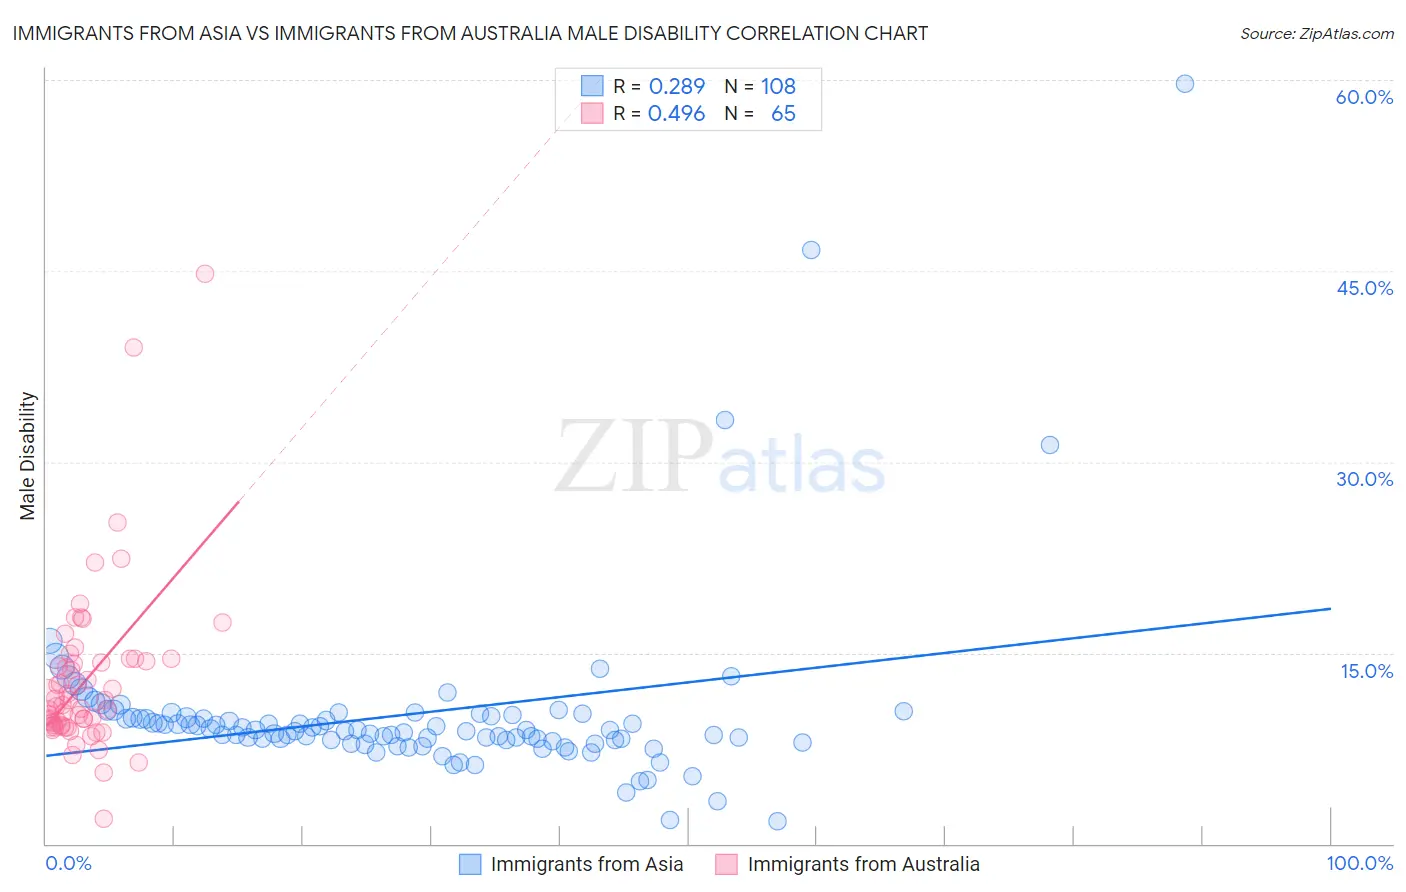
Immigrants from Asia vs Immigrants from Australia Male Disability Correlation Chart

The statistical analysis conducted on geographies consisting of 548,953,248 people shows a weak positive correlation between the proportion of Immigrants from Asia and percentage of males with a disability in the United States with a correlation coefficient (R) of 0.289 and weighted average of 10.0%. Similarly, the statistical analysis conducted on geographies consisting of 227,204,405 people shows a moderate positive correlation between the proportion of Immigrants from Australia and percentage of males with a disability in the United States with a correlation coefficient (R) of 0.496 and weighted average of 10.4%, a difference of 3.7%.
Immigrants from Asia vs Immigrants from Australia Male Disability

Male Disability Correlation Summary

MeasurementImmigrants from AsiaImmigrants from Australia
Minimum1.8%2.0%
Maximum59.7%44.7%
Range57.9%42.7%
Mean10.2%12.8%
Median8.9%10.9%
Interquartile 25% (IQ1)8.1%9.2%
Interquartile 75% (IQ3)10.1%14.4%
Interquartile Range (IQR)1.9%5.2%
Standard Deviation (Sample)7.1%6.6%
Standard Deviation (Population)7.1%6.6%

Similar Demographics by Male Disability

Demographics Similar to Immigrants from Asia by Male Disability

In terms of male disability, the demographic groups most similar to Immigrants from Asia are Cypriot (10.0%, a difference of 0.14%), Immigrants from Malaysia (10.0%, a difference of 0.19%), Immigrants from Venezuela (10.0%, a difference of 0.23%), Paraguayan (10.1%, a difference of 0.32%), and Burmese (10.0%, a difference of 0.51%).
DemographicsRating | RankMale Disability
Immigrants | Korea
100.0
/100
|
#17
Exceptional
9.8%
Immigrants | Pakistan
100.0
/100
|
#18
Exceptional
9.8%
Immigrants | Sri Lanka
100.0
/100
|
#19
Exceptional
10.0%
Asians
100.0
/100
|
#20
Exceptional
10.0%
Burmese
100.0
/100
|
#21
Exceptional
10.0%
Immigrants | Venezuela
100.0
/100
|
#22
Exceptional
10.0%
Cypriots
100.0
/100
|
#23
Exceptional
10.0%
Immigrants | Asia
100.0
/100
|
#24
Exceptional
10.0%
Immigrants | Malaysia
99.9
/100
|
#25
Exceptional
10.0%
Paraguayans
99.9
/100
|
#26
Exceptional
10.1%
Egyptians
99.9
/100
|
#27
Exceptional
10.1%
Vietnamese
99.9
/100
|
#28
Exceptional
10.1%
Venezuelans
99.9
/100
|
#29
Exceptional
10.1%
Immigrants | Egypt
99.9
/100
|
#30
Exceptional
10.1%
Soviet Union
99.9
/100
|
#31
Exceptional
10.1%

Demographics Similar to Immigrants from Australia by Male Disability

In terms of male disability, the demographic groups most similar to Immigrants from Australia are Immigrants from Colombia (10.4%, a difference of 0.060%), Immigrants from Japan (10.4%, a difference of 0.14%), Immigrants from Northern Africa (10.4%, a difference of 0.15%), Immigrants from South America (10.4%, a difference of 0.22%), and Tongan (10.4%, a difference of 0.24%).
DemographicsRating | RankMale Disability
Immigrants | Saudi Arabia
99.6
/100
|
#52
Exceptional
10.4%
Immigrants | Uzbekistan
99.6
/100
|
#53
Exceptional
10.4%
Peruvians
99.6
/100
|
#54
Exceptional
10.4%
Immigrants | Eritrea
99.6
/100
|
#55
Exceptional
10.4%
Tongans
99.6
/100
|
#56
Exceptional
10.4%
Immigrants | South America
99.6
/100
|
#57
Exceptional
10.4%
Immigrants | Japan
99.5
/100
|
#58
Exceptional
10.4%
Immigrants | Australia
99.5
/100
|
#59
Exceptional
10.4%
Immigrants | Colombia
99.5
/100
|
#60
Exceptional
10.4%
Immigrants | Northern Africa
99.4
/100
|
#61
Exceptional
10.4%
Immigrants | Ecuador
99.3
/100
|
#62
Exceptional
10.4%
Immigrants | Belarus
99.3
/100
|
#63
Exceptional
10.4%
Jordanians
99.3
/100
|
#64
Exceptional
10.5%
Immigrants | Grenada
99.2
/100
|
#65
Exceptional
10.5%
Guyanese
99.2
/100
|
#66
Exceptional
10.5%