Hungarian vs Serbian Disability Age Over 75

COMPARE

Hungarian
Race
Ancestry
AfghanAfricanAlaska NativeAlaskan AthabascanAlbanianAleutAlsatianAmericanApacheArabArapahoArgentineanArmenianAssyrian/Chaldean/SyriacAustralianAustrianBahamianBangladeshiBarbadianBasqueBelgianBelizeanBermudanBhutaneseBlackfeetBolivianBrazilianBritishBritish West IndianBulgarianBurmeseCajunCambodianCanadianCape VerdeanCarpatho RusynCelticCentral AmericanCentral American IndianCherokeeCheyenneChickasawChileanChineseChippewaChoctawColombianColvilleComancheCosta RicanCreeCreekCroatianCrowCubanCypriotCzechCzechoslovakianDanishDelawareDominicanDutchDutch West IndianEastern EuropeanEcuadorianEgyptianEnglishEstonianEthiopianEuropeanFijianFilipinoFinnishFrenchFrench American IndianFrench CanadianGermanGerman RussianGhanaianGreekGuamanian/ChamorroGuatemalanGuyaneseHaitianHmongHonduranHopiHoumaHungarianIcelanderIndian (Asian)IndonesianInupiatIranianIraqiIrishIroquoisIsraeliItalianJamaicanJapaneseJordanianKenyanKiowaKoreanLaotianLatvianLebaneseLiberianLithuanianLumbeeLuxembourgerMacedonianMalaysianMalteseMarshalleseMenomineeMexicanMexican American IndianMongolianMoroccanNative HawaiianNavajoNepaleseNew ZealanderNicaraguanNigerianNorthern EuropeanNorwegianOkinawanOsageOttawaPaiutePakistaniPalestinianPanamanianParaguayanPennsylvania GermanPeruvianPimaPolishPortuguesePotawatomiPuebloPuerto RicanPuget Sound SalishRomanianRussianSalvadoranSamoanScandinavianScotch-IrishScottishSeminoleSenegaleseShoshoneSierra LeoneanSiouxSlavicSlovakSloveneSomaliSouth AfricanSouth AmericanSouth American IndianSoviet UnionSpaniardSpanishSpanish AmericanSpanish American IndianSri LankanSubsaharan AfricanSudaneseSwedishSwissSyrianTaiwaneseThaiTlingit-HaidaTohono O'OdhamTonganTrinidadian and TobagonianTsimshianTurkishU.S. Virgin IslanderUgandanUkrainianUruguayanUteVenezuelanVietnameseWelshWest IndianYakamaYaquiYugoslavianYumanYup'ikZimbabwean
Immigration
NonimmigrantsImmigrantsAfghanistanAfricaAlbaniaArgentinaArmeniaAsiaAustraliaAustriaBahamasBangladeshBarbadosBelarusBelgiumBelizeBoliviaBosnia and HerzegovinaBrazilBulgariaBurma/MyanmarCabo VerdeCambodiaCameroonCanadaCaribbeanCentral AmericaChileChinaColombiaCongoCosta RicaCroatiaCubaCzechoslovakiaDenmarkDominicaDominican RepublicEastern AfricaEastern AsiaEastern EuropeEcuadorEgyptEl SalvadorEnglandEritreaEthiopiaEuropeFijiFranceGermanyGhanaGreeceGrenadaGuatemalaGuyanaHaitiHondurasHong KongHungaryIndiaIndonesiaIranIraqIrelandIsraelItalyJamaicaJapanJordanKazakhstanKenyaKoreaKuwaitLaosLatin AmericaLatviaLebanonLiberiaLithuaniaMalaysiaMexicoMicronesiaMiddle AfricaMoldovaMoroccoNepalNetherlandsNicaraguaNigeriaNorth AmericaNorth MacedoniaNorthern AfricaNorthern EuropeNorwayOceaniaPakistanPanamaPeruPhilippinesPolandPortugalRomaniaRussiaSaudi ArabiaScotlandSenegalSerbiaSierra LeoneSingaporeSomaliaSouth AfricaSouth AmericaSouth Central AsiaSouth Eastern AsiaSouthern EuropeSpainSri LankaSt. Vincent and the GrenadinesSudanSwedenSwitzerlandSyriaTaiwanThailandTrinidad and TobagoTurkeyUgandaUkraineUruguayUzbekistanVenezuelaVietnamWest IndiesWestern AfricaWestern AsiaWestern EuropeYemenZaireZimbabweAzores
Serbian
Race
Ancestry
AfghanAfricanAlaska NativeAlaskan AthabascanAlbanianAleutAlsatianAmericanApacheArabArapahoArgentineanArmenianAssyrian/Chaldean/SyriacAustralianAustrianBahamianBangladeshiBarbadianBasqueBelgianBelizeanBermudanBhutaneseBlackfeetBolivianBrazilianBritishBritish West IndianBulgarianBurmeseCajunCambodianCanadianCape VerdeanCarpatho RusynCelticCentral AmericanCentral American IndianCherokeeCheyenneChickasawChileanChineseChippewaChoctawColombianColvilleComancheCosta RicanCreeCreekCroatianCrowCubanCypriotCzechCzechoslovakianDanishDelawareDominicanDutchDutch West IndianEastern EuropeanEcuadorianEgyptianEnglishEstonianEthiopianEuropeanFijianFilipinoFinnishFrenchFrench American IndianFrench CanadianGermanGerman RussianGhanaianGreekGuamanian/ChamorroGuatemalanGuyaneseHaitianHmongHonduranHopiHoumaIcelanderIndian (Asian)IndonesianInupiatIranianIraqiIrishIroquoisIsraeliItalianJamaicanJapaneseJordanianKenyanKiowaKoreanLaotianLatvianLebaneseLiberianLithuanianLumbeeLuxembourgerMacedonianMalaysianMalteseMarshalleseMenomineeMexicanMexican American IndianMongolianMoroccanNative HawaiianNavajoNepaleseNew ZealanderNicaraguanNigerianNorthern EuropeanNorwegianOkinawanOsageOttawaPaiutePakistaniPalestinianPanamanianParaguayanPennsylvania GermanPeruvianPimaPolishPortuguesePotawatomiPuebloPuerto RicanPuget Sound SalishRomanianRussianSalvadoranSamoanScandinavianScotch-IrishScottishSeminoleSenegaleseSerbianShoshoneSierra LeoneanSiouxSlavicSlovakSloveneSomaliSouth AfricanSouth AmericanSouth American IndianSoviet UnionSpaniardSpanishSpanish AmericanSpanish American IndianSri LankanSubsaharan AfricanSudaneseSwedishSwissSyrianTaiwaneseThaiTlingit-HaidaTohono O'OdhamTonganTrinidadian and TobagonianTsimshianTurkishU.S. Virgin IslanderUgandanUkrainianUruguayanUteVenezuelanVietnameseWelshWest IndianYakamaYaquiYugoslavianYumanYup'ikZimbabwean
Immigration
NonimmigrantsImmigrantsAfghanistanAfricaAlbaniaArgentinaArmeniaAsiaAustraliaAustriaBahamasBangladeshBarbadosBelarusBelgiumBelizeBoliviaBosnia and HerzegovinaBrazilBulgariaBurma/MyanmarCabo VerdeCambodiaCameroonCanadaCaribbeanCentral AmericaChileChinaColombiaCongoCosta RicaCroatiaCubaCzechoslovakiaDenmarkDominicaDominican RepublicEastern AfricaEastern AsiaEastern EuropeEcuadorEgyptEl SalvadorEnglandEritreaEthiopiaEuropeFijiFranceGermanyGhanaGreeceGrenadaGuatemalaGuyanaHaitiHondurasHong KongHungaryIndiaIndonesiaIranIraqIrelandIsraelItalyJamaicaJapanJordanKazakhstanKenyaKoreaKuwaitLaosLatin AmericaLatviaLebanonLiberiaLithuaniaMalaysiaMexicoMicronesiaMiddle AfricaMoldovaMoroccoNepalNetherlandsNicaraguaNigeriaNorth AmericaNorth MacedoniaNorthern AfricaNorthern EuropeNorwayOceaniaPakistanPanamaPeruPhilippinesPolandPortugalRomaniaRussiaSaudi ArabiaScotlandSenegalSerbiaSierra LeoneSingaporeSomaliaSouth AfricaSouth AmericaSouth Central AsiaSouth Eastern AsiaSouthern EuropeSpainSri LankaSt. Vincent and the GrenadinesSudanSwedenSwitzerlandSyriaTaiwanThailandTrinidad and TobagoTurkeyUgandaUkraineUruguayUzbekistanVenezuelaVietnamWest IndiesWestern AfricaWestern AsiaWestern EuropeYemenZaireZimbabweAzores
Disability Age Over 75
Income
Poverty
Unemployment
Labor Participation
Family Structure
Vehicle Availability
Education Level
Disability

Disability Age Over 75 Comparison

Hungarians

Serbians

Exceptional
Exceptional
46.5%
DISABILITY AGE OVER 75
95.3/ 100
METRIC RATING
117th/ 347
METRIC RANK
46.1%
DISABILITY AGE OVER 75
99.0/ 100
METRIC RATING
75th/ 347
METRIC RANK

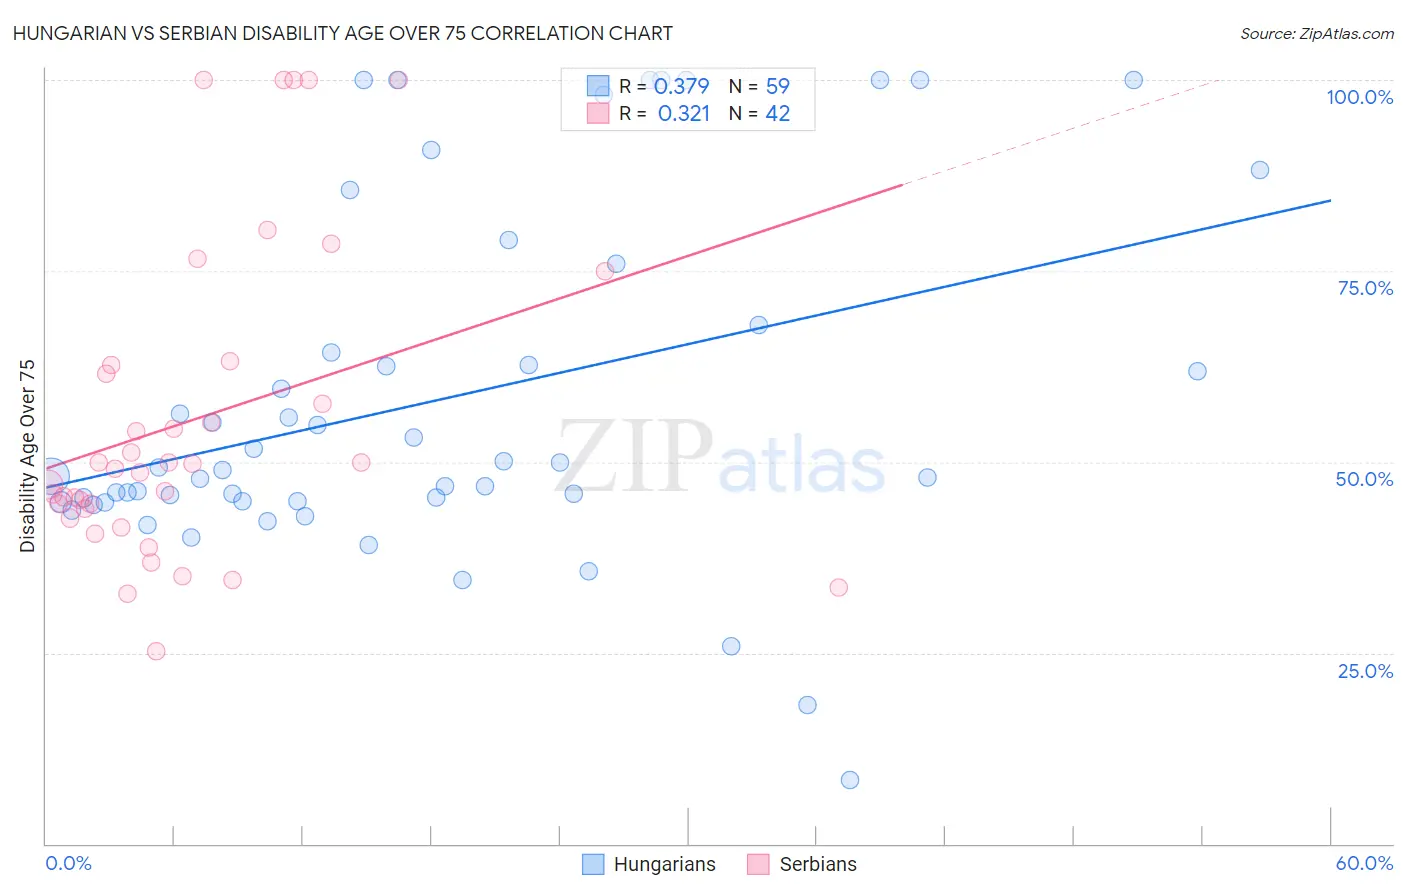
Hungarian vs Serbian Disability Age Over 75 Correlation Chart

The statistical analysis conducted on geographies consisting of 485,150,017 people shows a mild positive correlation between the proportion of Hungarians and percentage of population with a disability over the age of 75 in the United States with a correlation coefficient (R) of 0.379 and weighted average of 46.5%. Similarly, the statistical analysis conducted on geographies consisting of 267,445,172 people shows a mild positive correlation between the proportion of Serbians and percentage of population with a disability over the age of 75 in the United States with a correlation coefficient (R) of 0.321 and weighted average of 46.1%, a difference of 0.89%.
Hungarian vs Serbian Disability Age Over 75

Disability Age Over 75 Correlation Summary

MeasurementHungarianSerbian
Minimum8.3%25.2%
Maximum100.0%100.0%
Range91.7%74.8%
Mean58.0%55.6%
Median48.9%49.4%
Interquartile 25% (IQ1)44.8%43.9%
Interquartile 75% (IQ3)67.9%62.7%
Interquartile Range (IQR)23.1%18.8%
Standard Deviation (Sample)22.8%20.5%
Standard Deviation (Population)22.6%20.2%

Similar Demographics by Disability Age Over 75

Demographics Similar to Hungarians by Disability Age Over 75

In terms of disability age over 75, the demographic groups most similar to Hungarians are British (46.5%, a difference of 0.060%), Indian (Asian) (46.5%, a difference of 0.060%), Dutch (46.5%, a difference of 0.080%), Czechoslovakian (46.6%, a difference of 0.080%), and Irish (46.5%, a difference of 0.10%).
DemographicsRating | RankDisability Age Over 75
Immigrants | Hong Kong
96.4
/100
|
#110
Exceptional
46.5%
Immigrants | Chile
96.4
/100
|
#111
Exceptional
46.5%
Immigrants | Pakistan
96.1
/100
|
#112
Exceptional
46.5%
Irish
96.0
/100
|
#113
Exceptional
46.5%
Dutch
95.9
/100
|
#114
Exceptional
46.5%
British
95.7
/100
|
#115
Exceptional
46.5%
Indians (Asian)
95.7
/100
|
#116
Exceptional
46.5%
Hungarians
95.3
/100
|
#117
Exceptional
46.5%
Czechoslovakians
94.7
/100
|
#118
Exceptional
46.6%
Canadians
94.4
/100
|
#119
Exceptional
46.6%
Immigrants | Nepal
94.1
/100
|
#120
Exceptional
46.6%
Scandinavians
93.6
/100
|
#121
Exceptional
46.6%
Immigrants | Albania
93.2
/100
|
#122
Exceptional
46.6%
Immigrants | Colombia
92.6
/100
|
#123
Exceptional
46.7%
Immigrants | South America
91.8
/100
|
#124
Exceptional
46.7%

Demographics Similar to Serbians by Disability Age Over 75

In terms of disability age over 75, the demographic groups most similar to Serbians are Slavic (46.1%, a difference of 0.010%), Egyptian (46.1%, a difference of 0.040%), Immigrants from Eastern Asia (46.2%, a difference of 0.050%), Immigrants from Western Europe (46.2%, a difference of 0.060%), and Cambodian (46.1%, a difference of 0.080%).
DemographicsRating | RankDisability Age Over 75
Immigrants | South Central Asia
99.4
/100
|
#68
Exceptional
46.0%
Immigrants | Romania
99.3
/100
|
#69
Exceptional
46.0%
Jordanians
99.2
/100
|
#70
Exceptional
46.1%
Immigrants | Sri Lanka
99.2
/100
|
#71
Exceptional
46.1%
Immigrants | Hungary
99.1
/100
|
#72
Exceptional
46.1%
Cambodians
99.1
/100
|
#73
Exceptional
46.1%
Egyptians
99.0
/100
|
#74
Exceptional
46.1%
Serbians
99.0
/100
|
#75
Exceptional
46.1%
Slavs
98.9
/100
|
#76
Exceptional
46.1%
Immigrants | Eastern Asia
98.9
/100
|
#77
Exceptional
46.2%
Immigrants | Western Europe
98.8
/100
|
#78
Exceptional
46.2%
Swiss
98.8
/100
|
#79
Exceptional
46.2%
Soviet Union
98.8
/100
|
#80
Exceptional
46.2%
New Zealanders
98.8
/100
|
#81
Exceptional
46.2%
Immigrants | Latvia
98.7
/100
|
#82
Exceptional
46.2%